Treasury analytics for fintech startups means building automated, real-time visibility into cash positions, provider balances, and capital flows — replacing manual spreadsheet reconciliation with a governed data pipeline connected to a live BI layer. Done right, it turns treasury from a reactive accounting function into an operational control centre that leadership trusts and acts on daily.
If you run a fintech — a payments company, a neobank, a lending platform, or a BaaS provider — treasury is not a back-office concern. It is the engine your product runs on. Get it wrong and you are not just exposed to operational risk; you are exposed to regulatory risk, counterparty risk, and the very real possibility of funding misses that your customers will feel before your finance team does.
Yet a pattern we see repeatedly at growth-stage fintechs is exactly this: treasury visibility built entirely on spreadsheets, manual bank exports, and fragile email-driven workflows. The company is processing tens of millions in volume. The treasury view lives in a Google Sheet someone updates every morning — manually — before the 9am stand-up. That is not a treasury function. That is organised guessing.
This post covers what treasury analytics actually looks like in practice, why standard BI tools fail without the right data engineering underneath them, and how to build a data stack that gives you genuine, auditable visibility into liquidity, provider risk, and capital positions.
Why Do Fintech Startups Struggle With Treasury Visibility?
The root problem is architecture, not ambition. Most fintech founders are acutely aware that treasury matters. Many fintech founders treat treasury as an accounting function — but in reality, it is a product reliability function. The distinction matters enormously when you start to think about the data infrastructure required to support it.
The typical Series A fintech has treasury data spread across three to eight sources simultaneously: a banking API or SFTP feed from a sponsor bank, one or more e-money institution (EMI) accounts, a payment processor settlement ledger, an internal ledger system, an ERP or accounting platform, and sometimes a mix of custodian and safeguarding accounts. None of these talk to each other natively. The data arrives in different formats, at different cadences, with different identifiers and timezone conventions.
Manual workflows — spreadsheets and siloed systems — slow down decision-making and increase errors, while fragmented tech ecosystems with poor integration across banks and ERP systems delay reconciliation and reporting.
The result is a treasury team that spends the first two hours of every working day consolidating yesterday's positions by hand — and still isn't fully confident the numbers are right. We have seen this play out at multiple clients. The work is not complex; it is just manual, error-prone, and entirely unnecessary with the right data plumbing in place.
Research from April 2025 indicates that 70% of treasurers globally say that real-time treasury data has become critical to improving the treasury function — yet for most growth-stage fintechs, that real-time view remains out of reach, not because the technology does not exist, but because no one has built the data layer to support it.

📺 Watch: Treasury Technology in 10 Years :: Treasury FAQ #1

What Does a Proper Treasury Data Stack Actually Look Like?
Treasury analytics is not a dashboard problem. It is a data engineering problem. Before you can build any meaningful BI layer on top of treasury data, you need to solve for ingestion, normalisation, identity resolution, and governance. That is the work that actually unlocks the insight.
Here is the architecture we typically deliver for fintech clients:
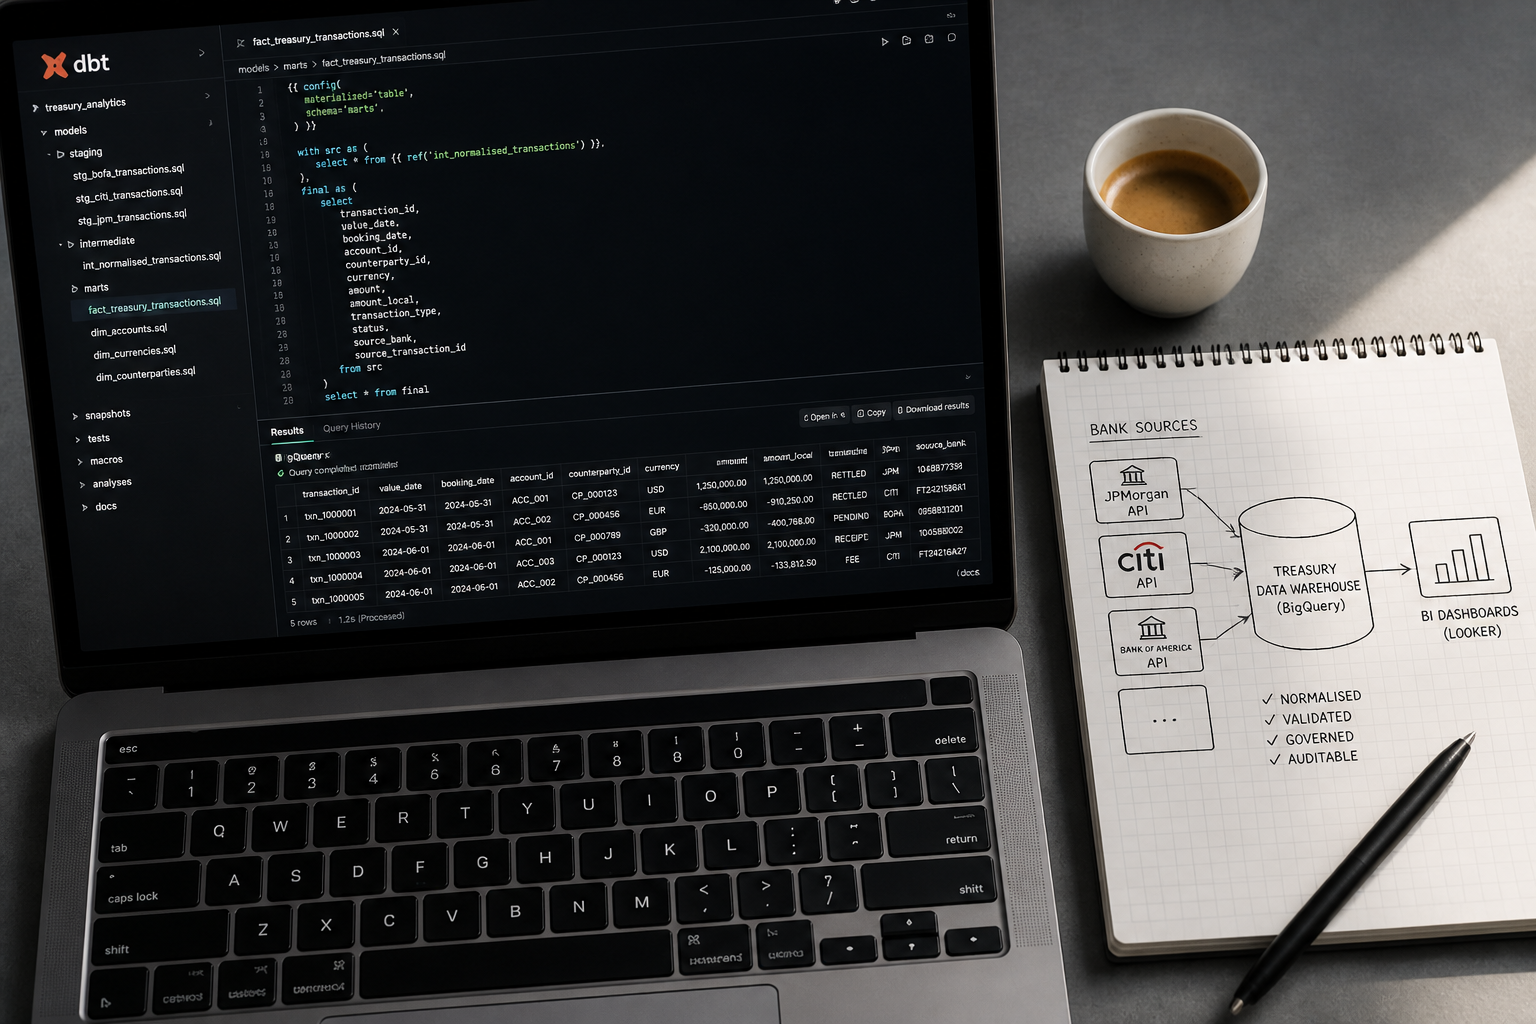
1. Ingestion layer Each treasury data source — bank APIs, processor settlement files, ledger exports — is connected via an automated ingestion pipeline. No manual CSV downloads. No email attachments. Connections are scheduled, monitored, and alerted on failure. We use tools like Fivetran, Airbyte, or custom Python-based extractors depending on the source's API maturity.
2. Staging and normalisation in dbt Raw source data lands in BigQuery (or AWS Redshift, depending on the client's existing stack) and is immediately normalised into a consistent schema using dbt models. This is where currency conversion, timezone standardisation, account identifier mapping, and transaction category tagging all live — in version-controlled SQL, not in a spreadsheet formula that only one person understands.
3. Semantic layer and business logic Core treasury metrics — net cash position, available liquidity by provider, settlement lag, safeguarding coverage ratio, intraday float — are defined once in the semantic layer and exposed consistently to every dashboard and report. This is the step most teams skip, and it is the reason the same metric shows three different numbers in three different spreadsheets.
4. BI and alerting With a clean, governed data model underneath, a live treasury dashboard in Holistics BI or Looker becomes straightforward to build and maintain. More importantly, automated alerts — threshold breaches, unexpected settlement delays, provider balance anomalies — can be triggered directly from the pipeline, giving the treasury team proactive visibility rather than reactive catch-up.
Analytic systems powered by ML and other types of AI provide unprecedented levels of transparency into cash, liquidity, inventory, funding, hedging, risk management and other core treasury functions. But that transparency only materialises if the underlying data is clean, connected, and trusted — which is a data engineering problem first.
If you want to understand how this data layer connects to a broader financial data strategy, our guide to Financial Close Analytics covers the complementary problem of close processes that still rely on manual data assembly.
What Are the Real Risks of Flying Blind on Treasury?
The consequences of inadequate treasury visibility are not hypothetical. We have seen them materialise at real companies. The risks fall into three distinct categories.
Funding misses and provider concentration risk When you cannot see your real-time position across providers, you cannot manage provider concentration risk. A provider going offline, hitting a settlement delay, or applying an unexpected hold does not surface until the next manual reconciliation run — by which point the operational impact has already landed. An automated alerting system gives treasury teams real-time visibility into provider risk for the first time, reducing funding misses and giving leadership a quantifiable measure of capital efficiency.
Undetected capital discrepancies In our experience working with payments and lending businesses, the gap between what a system says you hold and what you actually hold can be material — and can go undetected for weeks or months in a manual process. On one capital reconciliation engagement, we uncovered a $25M discrepancy that had gone undetected in the existing process. At market borrowing rates, that gap was costing the business over $6,000 per day. The discrepancy was not caused by fraud or system failure — it was caused by a reconciliation process that was too slow and too fragmented to surface it in time.
Regulatory exposure This is the risk that concentrates minds fastest. In 2026, regulators do not ask if you reconcile — they ask how fast, how often, and how provable it is. Real-time or near-real-time reconciliation is no longer a luxury. It is foundational infrastructure. A treasury data stack that produces an automated, timestamped audit trail is not just operationally valuable — it is the evidence a regulator expects to see when they come knocking.
If you are building out your data foundation alongside treasury visibility, our DataOps for Startups guide covers the pipeline reliability principles that apply directly to this kind of high-stakes operational data.
If you are evaluating how to build the broader data stack that treasury analytics sits within, explore how Fintel Analytics approaches this — we work with fintech businesses globally to design and deliver exactly this kind of solution.
How Do You Build a Treasury Dashboard That Finance Teams Actually Trust?
This is the question we get asked most often, and the answer is almost never about the dashboard tool itself. Finance teams distrust dashboards for one reason: they have been burned before. A dashboard showed a number. The number was wrong. No one caught it. A decision was made on bad data. Trust collapsed and the team went back to the spreadsheet.
Building a treasury dashboard that finance teams actually use requires solving for trust upstream, not downstream.
Data lineage and documentation Every metric displayed in a treasury dashboard should have an auditable lineage — from the raw source record, through the dbt transformation, to the figure on screen. This is not just good practice; it is the thing that lets a CFO answer "where does this number come from?" in under thirty seconds. In our delivery work, we document every metric definition in the dbt model itself, using dbt's built-in documentation features so the business logic is co-located with the code.
Reconciliation as a first-class data product Reconciliation is often treated as a reporting output. We treat it as a data product — a governed, automated pipeline with its own testing, alerting, and SLA. A reconciliation process that previously took 30–50 minutes to run manually has been rebuilt, in more than one client engagement, as an automated SQL pipeline that completes in under 3 seconds. The speed improvement is real, but the more important benefit is the elimination of human error from a process that finance depends on daily.
Metric consistency across teams One of the most common causes of dashboard distrust is the same metric showing a different number depending on who you ask. Finance says one thing, operations says another, treasury says a third. The fix is a SQL semantic layer where net cash position, available liquidity, and settlement exposure are defined once — and those definitions are enforced across every downstream tool. Weekly executive reporting that previously required 90 minutes of manual work by a finance analyst has been replaced, in multiple client engagements, by a live dashboard updated hourly with zero manual effort.
Over the next five years, 69% of CFOs expect greater emphasis on data analytics, 60% anticipate more scenario planning, and 55% say finance will become a more embedded strategic partner across the business. None of that happens while the treasury view is still a spreadsheet.
When Is the Right Time to Build a Treasury Analytics Stack?
This is a question of scale, risk, and cost — and the answer is almost always earlier than the company thinks.
The natural instinct is to wait until the pain is acute: until the manual process breaks, until a funding miss happens, or until a regulator asks a question you cannot answer quickly enough. By that point, you are building in a reactive state, under time pressure, with less clean source data than you would have had if you had started earlier.
In our experience, the right trigger points are:
- Transaction volume exceeds £1M/month processed: At this level, manual reconciliation lag starts creating material operational risk. A single settlement delay that goes unnoticed for 24 hours is already a business problem.
- You are working with more than two provider relationships: Each additional provider adds a new source of data and a new dimension of concentration risk. Managing three or more providers manually is where the spreadsheet model reliably breaks.
- You are approaching a licensing milestone: FCA e-money institution authorisation, AISP/PISP registration, or any licensing process that involves demonstrating operational controls will require evidence of systematic reconciliation and treasury monitoring. Building the data infrastructure before the application is infinitely easier than retrofitting it during.
- You are raising a Series A or Series B: Sophisticated investors will probe your treasury controls. A live, automated treasury dashboard is a stronger signal of operational maturity than a well-formatted spreadsheet.
Finance teams that succeeded in 2025 started small — automating reconciliation first, then forecasting, then cash visibility — building confidence one use case at a time. That sequencing is deliberate and we recommend it to every client: instrument the most critical position first, prove the pipeline works, then expand scope.
Frequently Asked Questions
Q: What is treasury analytics for fintech startups?
A: Treasury analytics for fintech startups is the practice of using data engineering and business intelligence tools to build automated, real-time visibility into cash positions, provider balances, settlement flows, and capital exposures — replacing manual spreadsheet-based processes with governed data pipelines and live dashboards. The goal is to give leadership and finance teams a single, trusted view of the company's liquidity at any point in time.
Q: What data sources feed into a fintech treasury analytics pipeline?
A: The typical sources include bank account APIs or SFTP feeds, payment processor settlement reports, internal ledger or core banking systems, ERP or accounting platforms (such as Xero, NetSuite, or Sage), and custodian or safeguarding account statements. The data engineering challenge is normalising these sources — which arrive in different formats, cadences, and schemas — into a single consistent model before any BI or alerting layer is built on top.
Q: How long does it take to build a treasury analytics stack?
A: A focused engagement covering ingestion, normalisation, core metric definitions, and a live dashboard typically takes four to eight weeks for a company with two to five treasury data sources and a clean enough source environment. The biggest variables are source data quality and API access complexity. Companies with well-documented APIs and structured source data move faster; those with legacy SFTP files and undocumented schemas take longer.
Q: What BI tools are best for fintech treasury dashboards?
A: The choice depends on your existing stack and team. For most growth-stage fintechs, Holistics BI or Looker built on top of BigQuery or Redshift provides a strong combination of governed metric definitions, scheduling, and access control. The more important decision is the semantic layer underneath — defining metrics in dbt before connecting any BI tool ensures consistency across dashboards regardless of which tool the team uses.
Q: How does treasury analytics relate to payments reconciliation analytics?
A: They are closely related but distinct. Payments reconciliation analytics focuses on matching individual transactions between systems — confirming that every payment processed is accounted for in the settlement ledger. Treasury analytics sits one level above: it aggregates across reconciled positions to give a real-time view of net liquidity, provider exposure, and capital deployment. In practice, a well-built treasury data stack includes a reconciliation layer as its foundation, with treasury-level metrics built on top.
For fast-growing fintechs, treasury visibility is not a nice-to-have — it is the operational control layer your entire product depends on. At Fintel Analytics, we have helped payments businesses, lending platforms, and financial services startups build exactly this kind of capability: from raw provider data through to production-grade pipelines, governed metric definitions, and live dashboards that finance teams actually trust. If your treasury view still lives in a spreadsheet, or if your team is spending meaningful hours each week on manual consolidation that a well-designed data pipeline would eliminate in seconds, that is a solvable problem — and one that pays back measurably from day one.