DataOps for early-stage startups means applying engineering discipline — automated testing, monitoring, alerting, and version control — to data pipelines before they grow too complex to fix. Done right, it prevents the silent failures that cause leadership to lose trust in their own numbers, and it scales with your business rather than against it.
Most startups invest heavily in building their data pipelines. Almost none invest in the discipline required to keep them working. The result is predictable: a board meeting where two dashboards show different revenue figures, a CFO who no longer trusts the weekly report, or a growth team making spend decisions based on a metric that stopped updating three weeks ago — and nobody noticed.
This is the DataOps gap, and it is endemic in companies between pre-seed and Series B. The tools are not the problem. BigQuery, dbt, Fivetran, Holistics — none of these are hard to deploy. The problem is the absence of the engineering practices that determine whether the data flowing through those tools can actually be trusted. That gap is fixable, but you have to know what you are building toward.
Why Do Early-Stage Startups Have Unreliable Data Pipelines?
The short answer is that startups optimise for speed, and data reliability is a discipline that requires deliberate investment. When you are shipping product and closing deals, nobody is arguing for time to write pipeline tests.
But the cost accumulates. 68% of organisations need four or more hours to detect data quality problems — and that detection lag is a critical challenge, with over two-thirds of companies unable to identify issues quickly, according to Monte Carlo's 2026 research. At a Series A company with twelve people in the data loop, four hours of bad data is not a minor inconvenience. It is twelve people making decisions on numbers that are wrong.
Data quality issues impact 31% of organisational revenue — companies report that poor data quality affects nearly one-third of their revenue through incorrect decisions, compliance failures, and operational inefficiencies, according to Monte Carlo's 2026 State of Data Quality Survey.
In our work with early-stage companies, the failure mode is almost always the same: a pipeline was built quickly during a sprint, it worked on day one, and then a source system changed. A column got renamed. An API started returning nulls in a field that used to be populated. A partner integration began sending timestamps in a different timezone. None of these changes triggered an error. The pipeline kept running. The data kept landing in the warehouse — silently wrong.
A pipeline can succeed technically — every activity completes without error — while delivering wrong, incomplete, or stale data. Without data quality checks, you won't know until someone downstream complains.
A pattern we see repeatedly: by the time a startup brings in an analytics consultant, they have between six and eighteen months of metrics they cannot fully trust. Rebuilding that history — or living without it — is a material cost to the business.
📺 Watch: (#3) Bearhug Recruiting's Early & Growth Stage Tech Startup Funding Recap! 4/29/24

What Does "DataOps" Actually Mean for a 20-Person Company?
DataOps gets discussed at the enterprise level, where teams have platform engineers, data engineers, and dedicated reliability roles. At a twenty-person startup, the same principles apply — but the implementation has to be leaner.
In practical terms, DataOps for an early-stage company means five things:
1. Version-controlled pipeline code. Your dbt models, your ingestion configuration, your transformation logic — all of it lives in Git. Not in a shared Notion doc. Not in someone's local machine. When something breaks, you can trace exactly what changed and when.
2. Automated data quality tests on every model. In dbt, this means not_null, unique, accepted_values, and relationship tests on every model that feeds a dashboard. A test failure should surface in CI/CD before it reaches production. Automated checks ensure data quality throughout your pipeline, preventing bad data from reaching downstream systems.
3. Alerting that routes to the right person. A data pipeline that fails at 2 AM and nobody notices until the CFO asks why the morning report has yesterday's numbers — this happens more often than most teams would like to admit. And it is almost always preventable. Alerts need to be actionable — routed to Slack or email, with context about which downstream reports are affected and what the likely cause is.
4. Data freshness monitoring. Knowing a pipeline ran is not the same as knowing your data is current. A job can succeed while processing a stale or empty source file. Freshness checks verify that key tables were actually updated within their expected window.
5. Documented lineage. When a metric is wrong, you need to trace it upstream in minutes — not hours. A lightweight lineage map (dbt generates this automatically) tells you which source tables feed which models, and which dashboards depend on which models.
Gartner's Strategic Planning Assumption predicts that data engineering teams guided by DataOps practices and tools will be ten times more productive than teams that do not use DataOps. That productivity gap compounds fast at a startup where one data engineer is supporting an entire product, finance, and growth function.
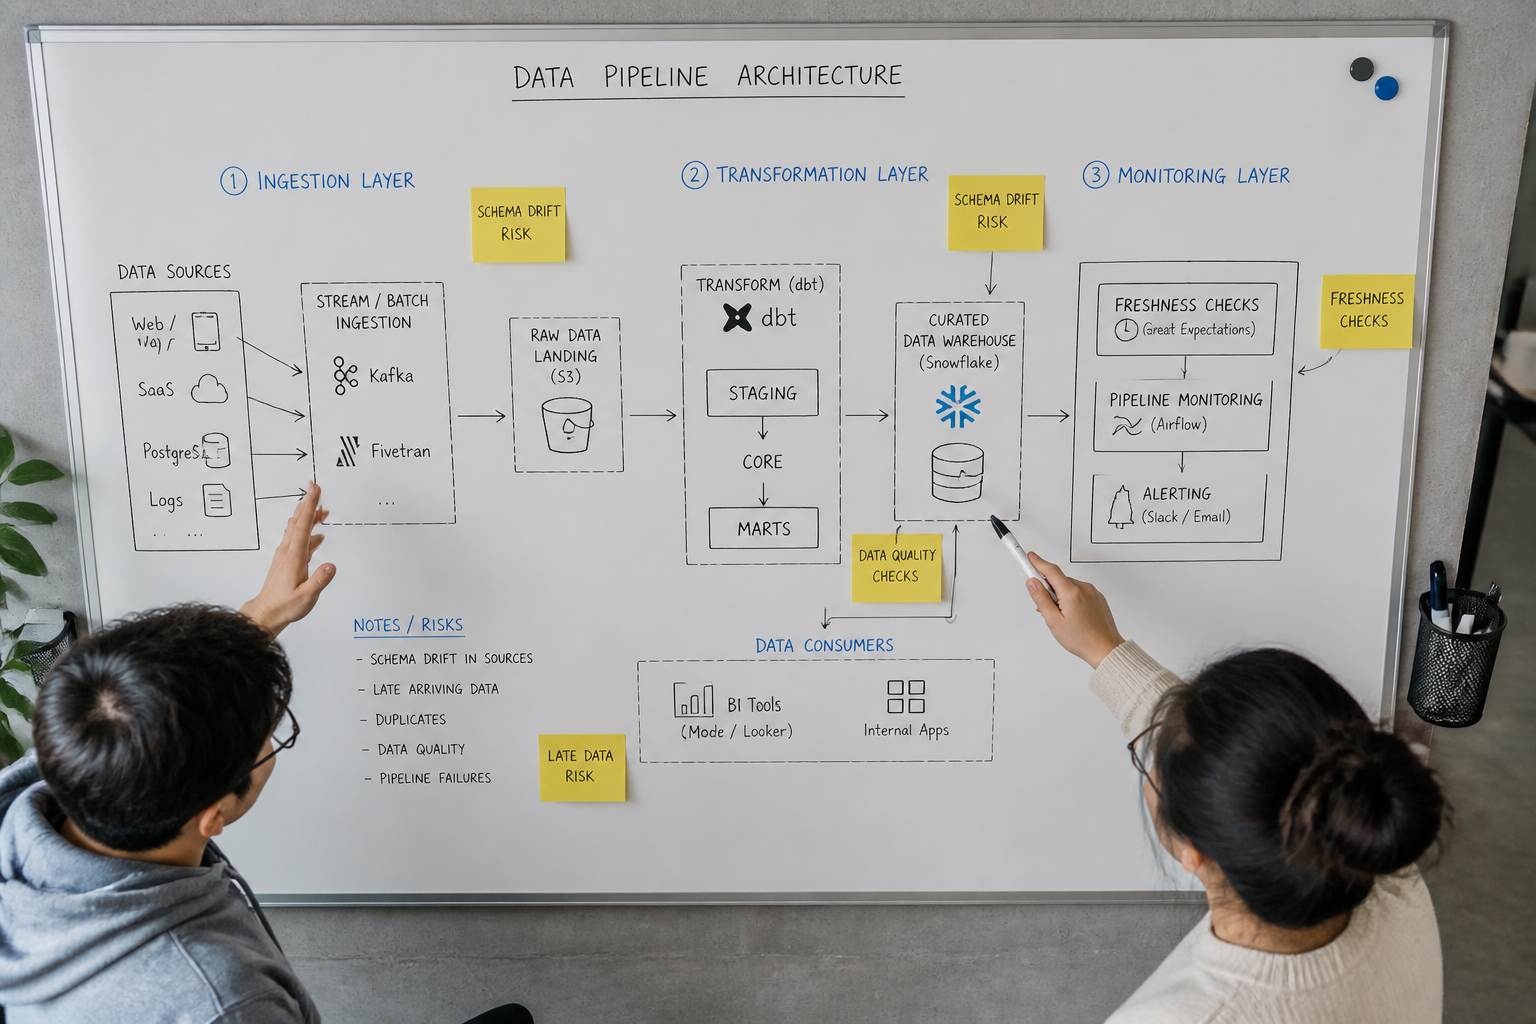
The Three Layers of Pipeline Monitoring You Cannot Skip
Most teams implement only one layer of pipeline monitoring — job success or failure. That is the minimum. The teams that get burned eventually implement all three.
Layer 1 — Operational monitoring: Did the job run? Did it complete? How long did it take? This is what most teams have. It catches hard failures — timeouts, crashes, connection errors. It does not catch silent data corruption.
Layer 2 — Data quality monitoring: Did the data that arrived meet expectations? Row counts within expected range? No nulls in fields that should never be null? No duplicates in tables that should be unique? Statistical anomaly detection can catch unusual patterns that basic threshold monitoring might miss. This layer is what separates teams that find out about problems from a Slack alert from teams that find out from an angry stakeholder.
Layer 3 — Business logic monitoring: Do the numbers make sense in context? If daily active users drops 80% overnight, that is almost certainly a tracking problem — not a real business event. If revenue for yesterday is zero, the pipeline probably broke. Embedding these sanity checks into your dbt tests, or wrapping them in a lightweight monitoring query that runs post-pipeline, catches the class of issues that would otherwise erode stakeholder trust silently over weeks.
As pipelines scale to handle higher volumes, more transformations, and stringent SLA requirements, the risks of undetected problems grow significantly. Effective monitoring acts as a safeguard, allowing teams to detect and resolve issues such as data delays, schema mismatches, or quality degradation before they impact business applications.
One of the most common mistakes we see is teams treating monitoring as a post-launch task. By then, the pipelines are in production, stakeholders are relying on them, and adding tests retroactively feels risky. Building monitoring in from the first model takes perhaps 20% longer on day one and saves multiples of that time across every sprint that follows.
If you are looking to implement this kind of structured data engineering practice in your organisation, explore how Fintel Analytics approaches this — we work with pre-seed through Series B companies globally to design and deliver exactly this kind of production-grade data infrastructure.
How Should You Handle Schema Changes From Source Systems?
Schema drift is one of the most underestimated risks in a startup data stack. Your data pipelines depend on upstream systems — Stripe, Salesforce, your product database, third-party APIs — maintaining a consistent structure. In practice, they do not.
Source schemas change. A column gets renamed, a new column appears, a data type changes. These changes can break pipelines or, worse, load data into wrong columns.
The dangerous scenario is not the hard break — the pipeline crash that shows up red in your monitoring dashboard. It is the silent degradation. A field that used to contain a customer's country code now contains a full country name. Your pipeline keeps running. Your segmentation logic quietly starts returning wrong results. Three weeks later, someone in growth notices that their APAC campaign is showing zero conversions in a region that is definitely converting.
The defence against schema drift has three components:
- Schema validation at ingestion. Your ELT tool (Fivetran, Airbyte, or custom scripts) should be configured to alert on schema changes rather than silently adapting to them. Treat a new or renamed column as an incident, not an automatic update.
- Strongly typed dbt sources. Declare your source schemas explicitly in dbt's
sources.yml. Use source freshness and column-level tests. When the source no longer matches your declaration, the test fails before the bad data reaches your marts. - Change communication protocols. This is the least technical and most neglected piece. When your engineering team changes a database schema, the data team needs to know — before the deployment, not after. A shared Slack channel and a one-line PR comment costs nothing and prevents hours of debugging.
We rebuilt a reconciliation pipeline for a fintech client that had been silently misallocating transactions for six weeks because a source system began sending amounts in minor currency units without notice. Identifying the root cause took two hours. The discrepancy it had introduced into their reporting took considerably longer to unwind.
What Does a Practical DataOps Setup Look Like on a Startup Budget?
The most common objection we hear is cost — that DataOps infrastructure is something you build at Series B when you have a team. This is exactly backwards. The time to build good practices is before the mess exists, not after.
A lean but production-grade DataOps setup for a Series A company looks like this:
Version control: GitHub or GitLab. Already in use for your product codebase. Free for the relevant tier. Your dbt project lives here alongside your application code.
Transformation and testing: dbt Core is open-source. Your entire transformation layer — SQL models, tests, documentation, lineage — is code, version-controlled, and testable. The investment is in writing the tests, not in paying for tooling.
Orchestration: For most startups, a managed solution (dbt Cloud, Dagster Cloud, or Airflow on a managed provider) is far cheaper than maintaining your own orchestration infrastructure. Budget £200–600/month depending on job volume.
Alerting: PagerDuty or direct Slack webhook integration with your orchestrator. A failed dbt test or a missed pipeline window should post to a dedicated #data-alerts channel with enough context to act. Not just "pipeline failed" — which model, which test, which downstream dashboards are at risk.
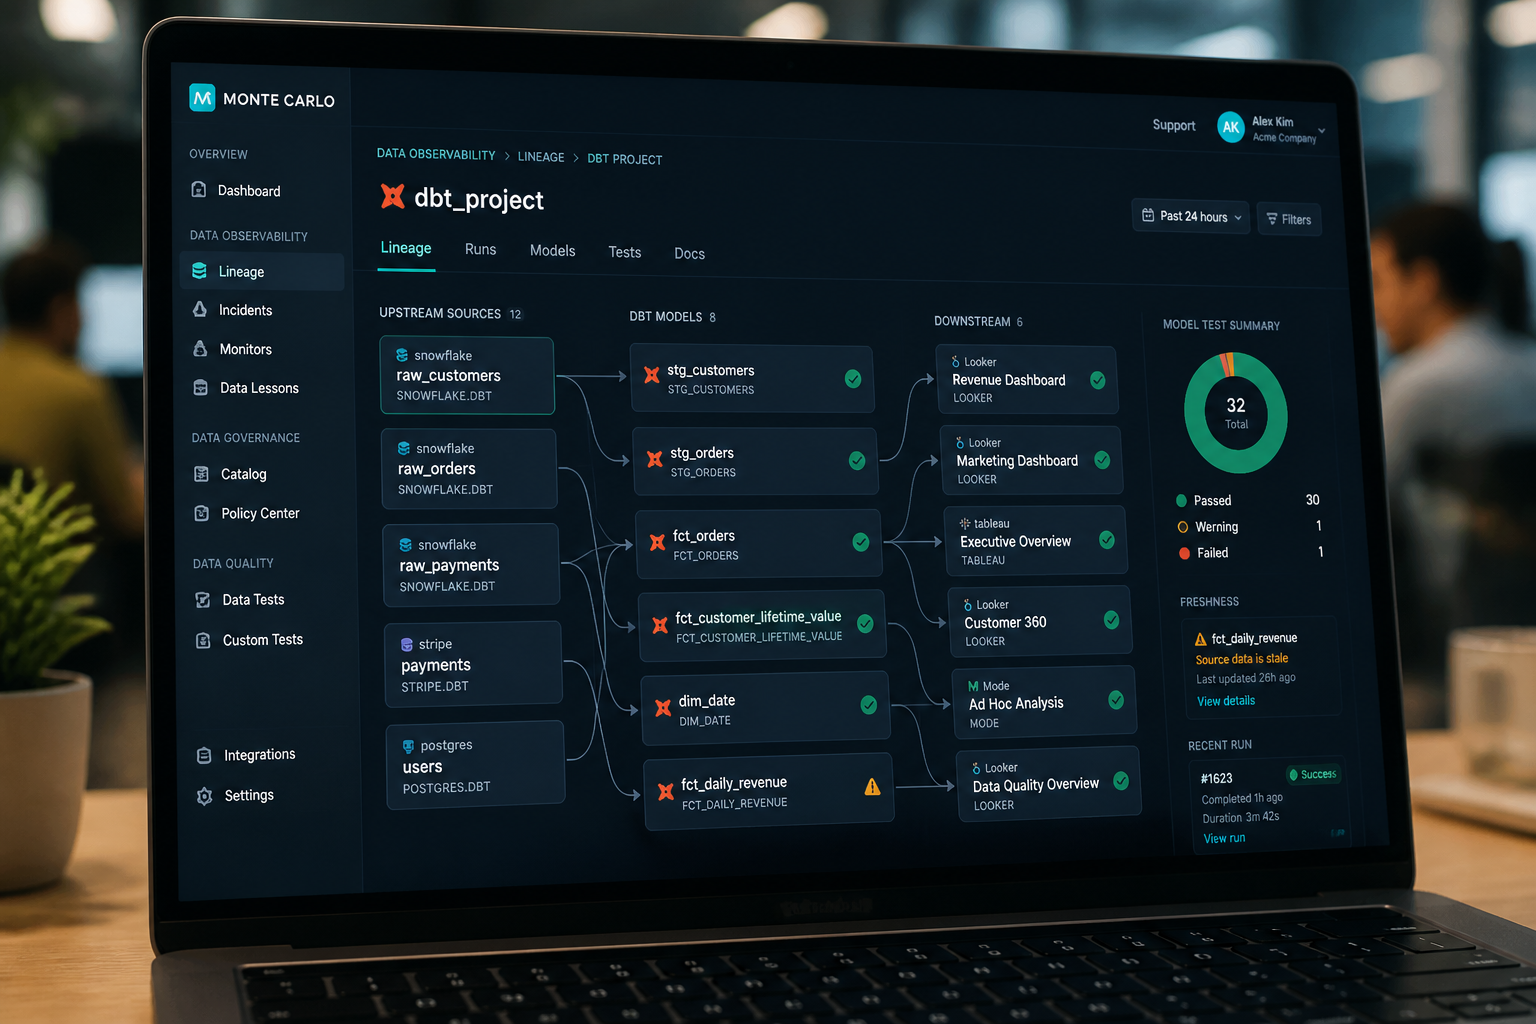
Observability (as you grow): Tools like Monte Carlo, Elementary (open-source), or Metaplane sit on top of your dbt project and add statistical anomaly detection, lineage tracking, and incident management. For a sub-50-person company, Elementary is free and covers most of what you need.
The total incremental cost of this setup over a bare-bones data stack is modest. The payoff is measurable: we migrated calculations from spreadsheets into dbt models for a global payments client, eliminating a class of recurring manual errors and cutting weekly maintenance time by 30 minutes per engineer. That payoff compounds every week the system is in production.
When it comes to building metrics that multiple teams need to trust, a SQL semantic layer is the natural complement to a robust DataOps setup — it ensures that once your data is clean and reliably delivered, every team is reading from the same definition of "revenue" or "active user", rather than recalculating it differently in every dashboard.
What Are the Warning Signs Your DataOps Practice Is Failing?
You do not need to wait for a crisis to diagnose a DataOps problem. These are the signals we look for when auditing a new client's data infrastructure:
Dashboard discrepancies. Finance reports one revenue figure; the growth team reports another. Both are reading from the same underlying data but through different calculation paths — and nobody has resolved the conflict. This is not a dashboard problem. It is a data modelling and governance problem downstream from a DataOps failure.
High "who knows?" rates in stakeholder meetings. When a metric is questioned in a meeting and the answer is "I'll need to check that," the DataOps discipline is not in place. In a well-monitored stack, the answer is "the dashboard is accurate as of one hour ago, tested and deployed this morning."
Manual reconciliation as a routine task. If someone on your team is manually cross-checking a report against a spreadsheet every Monday morning, that is a DataOps debt that will grow. Those 30–90 minutes per week are a quantified cost of not having automated tests and monitoring.
Fear of changing pipeline code. When engineers are reluctant to update a transformation model because "last time something broke and we didn't know until Tuesday," that fear is diagnostic. It means there are no tests, no CI, and no monitoring — and the pipeline is running on hope.
Monitoring your data pipelines isn't just about catching errors. It's about protecting your business from blind spots, building confidence in data, and scaling operations without scaling chaos.
We replaced a weekly executive reporting process for a Series A company that required 90 minutes of manual effort every Monday. A live dashboard — tested, monitored, and deployed via dbt and Holistics — replaced it entirely. Zero manual effort, updated hourly. The 90 minutes per week was a direct saving; the reduction in errors and the increase in leadership confidence in the numbers was harder to quantify but more valuable.
Frequently Asked Questions
Q: What is DataOps and why does it matter for startups?
A: DataOps is the application of software engineering practices — version control, automated testing, continuous integration, monitoring, and alerting — to data pipelines and analytics workflows. For startups, it matters because it is the difference between a data stack that stays trustworthy as the business scales and one that silently degrades until stakeholders stop believing the numbers.
Q: When should an early-stage startup start investing in DataOps?
A: From the first production pipeline. The cost of retrofitting DataOps practices into a mature, untested pipeline is far higher than building them in from the start. If you are at pre-seed and you have one dbt model feeding one dashboard, that is the right time to add your first data test and your first pipeline alert.
Q: How do I monitor data pipeline reliability without a dedicated data engineer?
A: Start with dbt's built-in test framework — not_null, unique, and accepted_values tests on every source and mart model. Add Elementary (open-source) for anomaly detection and Slack alerting. Set up freshness checks on your critical source tables. This setup takes a day to implement and runs automatically from there.
Q: What is the biggest DataOps mistake early-stage startups make?
A: Treating monitoring as optional. Most startup data stacks are built without a single automated test. Pipelines run in production with no validation, no freshness checks, and no alerting. The first indication of a problem is a stakeholder noticing something wrong — by which point bad data has already influenced decisions. Automated tests and alerts are not a luxury; they are the minimum viable data stack.
Q: How does DataOps relate to tools like dbt and BigQuery?
A: dbt and BigQuery are the delivery layer — the tools in which you build and run your transformations. DataOps is the practice layer that determines whether those tools produce trustworthy output. dbt's test framework, documentation, and lineage features make it a natural home for DataOps discipline in the modern data stack. BigQuery's audit logs and query monitoring complement this at the infrastructure level. For teams experiencing performance issues at this layer, it is worth reviewing why dbt models slow down under load as part of a broader DataOps audit.
If your pipelines are running but your numbers are not trustworthy — or your team is spending every Monday reconciling reports instead of acting on them — that is a DataOps problem, and it is entirely fixable. At Fintel Analytics, we have helped fintech, payments, and e-commerce businesses implement production-grade DataOps practices from first pipeline to full observability, working within the constraints of small teams and startup budgets. The businesses we work with stop firefighting their data and start trusting it — and that trust pays dividends every single week.