Why Your dbt Models Are Running Slow — And How to Fix It
Slow dbt models are almost always the result of one of five fixable root causes: the wrong materialisation strategy, missing partition or cluster keys, poorly structured DAGs, unconstrained full-table scans, or runaway thread configurations. Identifying which one you are hitting — and in what combination — is the difference between a pipeline that completes in minutes and one that runs for hours while your cloud bill climbs.
If you have landed here because your dbt runs are taking too long, your BigQuery or Snowflake costs are creeping up quarter-on-quarter, or your downstream dashboards are stale by the time your team starts work, this post is written for you. We have seen every one of these failure modes in production, across fintech, payments, and e-commerce businesses at every growth stage from seed to Series B.
What Actually Causes dbt Models to Run Slowly?
Before reaching for solutions, it is worth being precise about the cause. In our experience, slow dbt projects almost never have a single root cause — they are the accumulated result of reasonable decisions made early in a project's life that have not been revisited as data volumes grew.
The most common culprits, in order of frequency:
1. Everything is materialised as a table and rebuilt from scratch on every run. This is the most common starting point and the one that causes the most damage at scale. When every model is a full-refresh table, your warehouse is reprocessing your entire dataset on every pipeline run — even if only 0.1% of it changed since the last run. As one published case study from dbt Labs (2025) shows, this pattern has real financial consequences: switching from full-refresh tables to incremental models helped one company cut daily warehouse credit usage by 70% while also reducing data latency from 12 hours to just 2 hours.
2. Full table scans on large source tables.
In BigQuery, you are billed based on the bytes your queries actually scan — not the rows they return. A SELECT * against a large, unpartitioned events table does not care that your WHERE clause filters down to a single day; it scans every column across the entire table. At $6.25 per TiB on on-demand pricing, this adds up fast, and a single misconfigured join running in a scheduled dbt job can trigger hundreds of terabytes of unnecessary scanning before anyone notices.
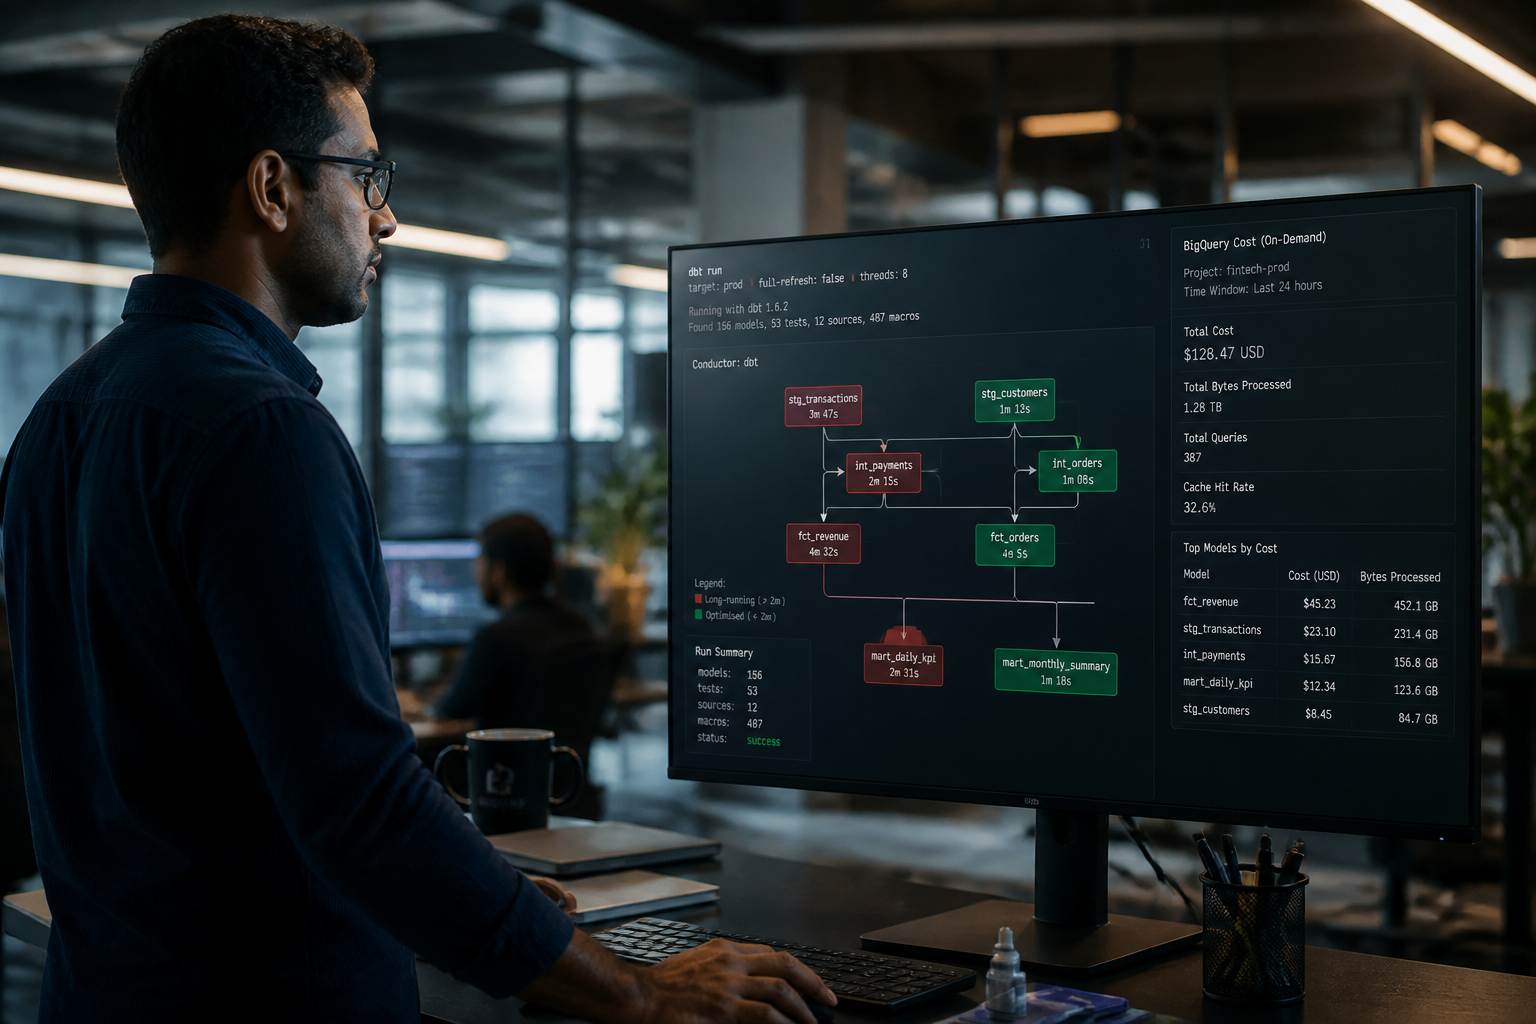
3. A DAG shaped like a traffic jam. Many dbt projects grow organically — models are added as needed, dependencies evolve, and before long you have a DAG where a handful of wide, expensive models block every downstream mart. When those bottleneck models run sequentially and cannot be parallelised, your total run time becomes the sum of the slowest path rather than the shortest.
4. Too few threads. By default, dbt runs with a low thread count. If you are running 80 models with 4 threads, you are leaving parallelism on the table. This is one of the fastest wins available — a configuration change that can halve run time in a project of moderate complexity without touching a single SQL file.
5. Tests that scan full tables repeatedly. dbt tests are an essential quality check, but running schema tests and custom data tests against unpartitioned, unfiltered source tables can account for a significant share of your total compute cost — sometimes more than the transformation models themselves.
📺 Watch: 5 Tips to Improve Your dbt Project

The Full-Refresh Problem: When Simple Becomes Expensive
The full-refresh materialisation is dbt's simplest and most honest approach: drop the table, rebuild it from scratch, done. It is the right starting point for small datasets and dimension tables where data integrity matters more than speed. For a reference table with a few thousand rows, there is no good reason to add incremental complexity.
The problem is that teams rarely revisit this decision as their data grows. A model that rebuilt in 12 seconds at launch rebuilds in 45 minutes two years later — and nobody has flagged it because nobody has instrumented run times.
The dbt docs are explicit on this: incremental models process only new or changed data rather than rebuilding the entire table, which speeds up model execution and reduces warehouse cost, especially when dealing with large or continuously growing datasets. The mechanics are straightforward — dbt creates a temporary snapshot of new records and merges them into the existing table, applying only the rows that pass your is_incremental() filter.
The practical question is when to make the switch. Our rule of thumb:
- Stay on full-refresh if the model rebuilds in under 30 seconds and the source data can change retroactively (e.g., a slowly-changing dimension).
- Move to incremental when rebuild time exceeds 60 seconds, the source data appends rather than updates, or the model is running more than once per hour.
- Use incremental with a lookback window (typically 3–7 days) to catch late-arriving data while still avoiding full scans.
One important nuance: incremental models require you to handle schema changes explicitly. dbt's on_schema_change configuration gives you control here — options like sync_all_columns will add new columns and remove missing ones automatically, which reduces the number of forced full-refresh runs needed when your upstream schema evolves.
A pattern we see repeatedly in fast-growing e-commerce and payments businesses: a single high-volume event table — transactions, clicks, ledger entries — is modelled as a full-refresh table early in the project and never revisited. By the time the team notices the pipeline is slow, that one model is consuming 60–70% of the total run time and a disproportionate share of the monthly cloud bill.
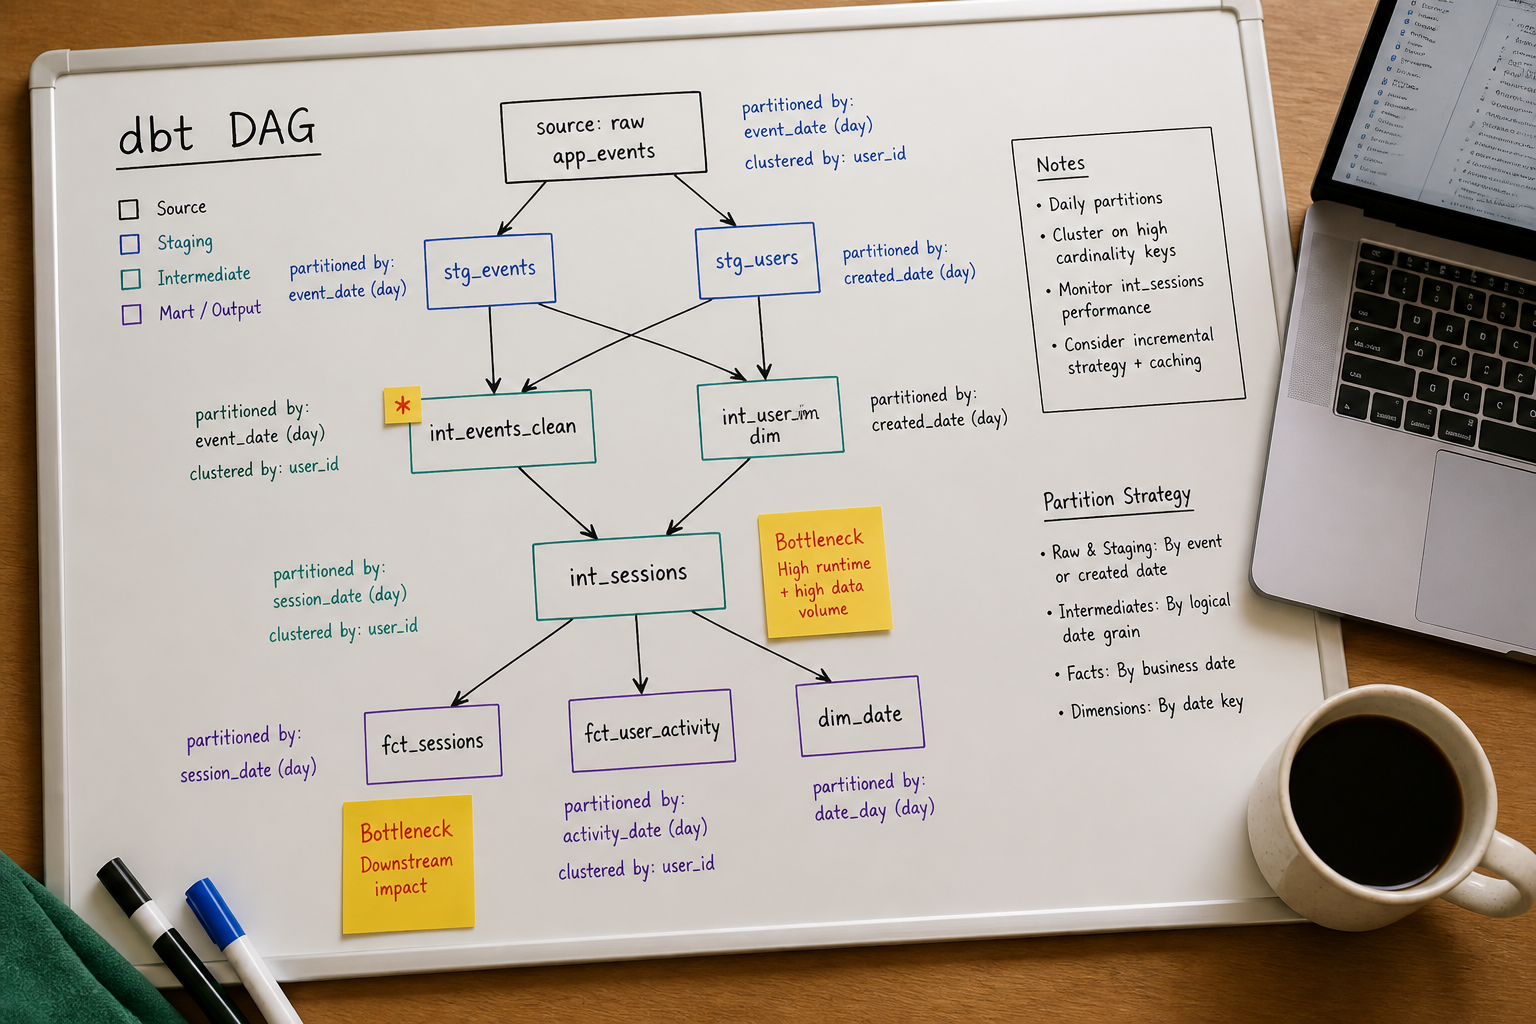
How Partitioning and Clustering Fix the Cost Problem at Its Root
Incremental materialisation solves the "how much data you rebuild" problem. Partitioning and clustering solve the "how much data you scan" problem. You need both.
In BigQuery, partitioning divides a table into segments — typically by date — so that a query filtering on created_at reads only the relevant partition rather than the entire table. Clustering goes further, sorting data within each partition by one or more columns so that BigQuery can skip irrelevant data blocks entirely during a scan.
The impact is significant. Proper use of partitioning and clustering can reduce query costs by up to 90% for time-series analytical workloads — a figure that aligns with what we have seen in practice on high-volume transaction tables.
There is one critical trap teams fall into here: applying a function to your partition column inside a WHERE clause defeats the optimisation entirely. A filter like WHERE EXTRACT(YEAR FROM created_at) = 2025 forces a full table scan even on a perfectly partitioned table, because BigQuery cannot apply partition pruning to a derived value. Your filter must reference the partition column directly.
In dbt, you configure this in your model's config block:
{{ config(
    materialized='incremental',
    partition_by={'field': 'created_at', 'data_type': 'timestamp', 'granularity': 'day'},
    cluster_by=['merchant_id', 'transaction_status']
) }}
This single configuration change — applied to a large transactions model — is often the most impactful optimisation available in a typical early-stage fintech or payments project.
If you want to understand exactly how Fintel Analytics approaches dbt architecture and query optimisation for growth-stage businesses, explore our services — we design and deliver exactly this kind of modern analytics stack for fintech, payments, and e-commerce clients globally.
How to Diagnose a Slow dbt Project in Under 30 Minutes
You do not need to instrument everything to find the bottleneck. Most of the information you need is already available.
Step 1: Pull your run logs and sort by model execution time. In dbt Cloud, the Performance overview page shows your longest-running models, most frequently executed models, and models with the highest failure rates. If you are running dbt Core with a scheduler, your orchestrator logs will give you per-model timing. Sort descending by run time. The Pareto principle applies almost universally here — the top 5–10% of models by run time will account for 70–80% of total pipeline duration.
Step 2: Check materialisation type for your slowest models.
For each slow model, ask: is this table, view, incremental, or ephemeral? If your longest-running models are all table — especially event-level or transaction-level fact tables — you have found your first fix.
Step 3: Audit partition and cluster coverage. For each slow table model, run a dry query in BigQuery (using the "dry run" feature before executing) to see how many bytes will be scanned. If a simple one-day filter is scanning your entire table history, you are missing partition coverage on that model.
Step 4: Review your thread configuration.
dbt runs models in parallel up to your configured thread count. Check your profiles.yml — many teams leave this at 4. For a project with 50+ models running on a modern cloud warehouse, increasing threads to 8–16 is typically safe and can meaningfully reduce total run time by enabling more parallelism across independent branches of your DAG.
Step 5: Check whether tests are scanning full tables.
Look at your schema.yml test definitions. If you are running not_null or unique tests on large, unpartitioned source tables, consider whether those tests need to run on the full table or whether a filtered version would catch the same issues. Alternatively, run tests only on models that have changed in a given run using dbt's state-aware execution.
A real example from our delivery work: a Series A payments company had a dbt pipeline running for 47 minutes every hour. After a structured audit — materialisation review, partition coverage check, DAG analysis — we identified three models accounting for 38 minutes of that run time, all of which were full-refresh tables operating on multi-year transaction histories. Converting them to partitioned incremental models brought total run time to under 8 minutes, reduced the BigQuery bill materially, and gave downstream teams fresher data.
The DAG Design Mistakes That Multiply Run Time
Even a perfectly optimised set of individual models can produce a slow pipeline if the DAG is shaped badly. Two patterns cause the most damage:
Wide fan-in at expensive models. When a single mart model depends on 15 upstream staging models, and those staging models cannot all be parallelised because of shared intermediate dependencies, you end up with a long critical path. The fix is to restructure intermediate models so that independent branches can run concurrently rather than sequentially.
Duplicated logic across models. A pattern we see repeatedly in analytically immature projects: the same business logic — a revenue calculation, a customer status derivation — is written inline across multiple mart models rather than centralised in a single intermediate model. Each instance runs separately, scans the same source data, and performs the same computation. Centralising that logic into one well-optimised intermediate model reduces both run time and the maintenance burden that comes from keeping multiple copies of the same logic in sync.
This connects directly to a broader principle: if you cannot explain what a model does in one sentence, it is probably doing too much. Models that are responsible for too many transformations are harder to optimise, harder to test, and harder to debug. Splitting them into focused, modular units — staging, intermediate, mart — gives you more surfaces to apply performance tuning and more flexibility to materialise different layers differently.
Migrating sprawling, multi-purpose models into properly layered dbt architecture is something we have done for multiple clients. In one case, moving business logic from spreadsheets and ad hoc SQL into structured dbt models eliminated a recurring class of manual calculation errors and cut weekly pipeline maintenance time by 30 minutes — a small number individually, but material when compounded across a team operating under delivery pressure.
Frequently Asked Questions
Q: How do I know if my dbt models are too slow?
A: The clearest signal is downstream impact: are your dashboards stale by the time your team starts work? Are scheduled jobs running over their allocated window and delaying dependent processes? Pull per-model run times from your dbt Cloud performance view or orchestrator logs. If any single model is taking more than 5 minutes to rebuild, it warrants investigation. For most growth-stage companies, a complete dbt pipeline should run in under 15–20 minutes.
Q: When should I use incremental models instead of table materialisation in dbt?
A: Use incremental models when your source data primarily appends (events, transactions, log data), when full-rebuild time exceeds 60 seconds, or when the model runs more than once per hour. Keep full-refresh tables for dimension tables with complex slowly-changing logic, reference data that changes retroactively, or any model where rebuild time is under 30 seconds and simplicity is more valuable than marginal performance gains.
Q: How much can partitioning reduce my BigQuery costs from dbt runs?
A: Significant savings are possible. Proper partitioning and clustering strategies can reduce query costs by up to 90% for time-series analytical workloads by ensuring queries scan only relevant data partitions rather than full tables. The actual saving depends on your query patterns and data volume, but for a high-volume transaction table queried daily, the impact is typically material — often reducing per-query scan costs by 60–80%.
Q: What is the right thread count for dbt?
A: The default is low — often 4 — and most production projects should be running higher. A reasonable starting point for a project with 40+ models on a cloud warehouse is 8–12 threads. Increase incrementally and monitor for warehouse concurrency limits. Thread count has no impact on individual model run time but significantly reduces total pipeline duration by enabling more models to run in parallel.
Q: How do I prevent runaway dbt query costs in BigQuery?
A: Set maximum_bytes_billed limits at the model level in your dbt_project.yml config block — this causes a query to fail before scanning beyond your defined threshold rather than running to completion and generating an unexpected bill. Combine this with project-level custom quotas in GCP, monitor your top-10 models by bytes processed weekly, and use dry runs before deploying new models to production.
Conclusion
Slow dbt models are a fixable problem — but fixing them properly requires diagnosing the actual root cause rather than applying generic advice. The businesses we work with at Fintel Analytics typically arrive with a combination of all five issues described in this post: materialisation choices that made sense at launch but have not scaled, missing partition coverage on high-volume tables, DAGs that serialise work that could run in parallel, and no instrumentation to tell them how bad the problem has become. We have seen these patterns in fintech, payments, and e-commerce businesses globally — and in every case, the fix has been a structured audit followed by targeted, incremental changes rather than a full rewrite. If your pipeline is slowing your team down and your cloud bill is growing faster than your data volume justifies, that gap between what you are paying and what you should be paying is entirely recoverable.