 Fintel Analytics
Open Banking Data Analytics: Turn API Feeds Into Intelligence
Open banking API feeds generate enormous volumes of raw transaction data — but most fintech teams lack the analytics layer to turn it into decisions. Here's how to fix that.
Open Banking Data Analytics: How to Turn API Feeds Into Actual Intelligence
Open banking data analytics is the practice of ingesting, normalising, and modelling raw financial API feeds — from account information services, payment initiation, and transaction history — into structured, queryable data products that drive real business decisions. Done well, it gives fintech teams the ability to underwrite faster, detect risk earlier, and build smarter customer products. Done poorly — which is the default for most early-stage companies — it gives you a warehouse full of unprocessed JSON blobs and dashboards nobody trusts.
The volume of open banking data available today is staggering. The UK open banking ecosystem alone recorded 24.0 billion successful API calls in 2025, up 27% on 2024. Globally, Juniper Research estimates that global open banking API calls will jump from 137 billion in 2025 to more than 722 billion by 2029. That is not a data access problem. The problem — the one we see repeatedly at Fintel Analytics — is that most fintech startups are generating mountains of raw API data and extracting almost none of the intelligence locked inside it.
This post is about how to close that gap, from the data engineering foundations to the analytics models that actually inform decisions.
Why Do Fintech Teams Struggle to Analyse Open Banking Data?
The answer is almost always structural, not technical. The engineers who integrate the open banking APIs are not the same people who need to answer business questions from the data. By the time data reaches a warehouse — if it reaches one at all — it is typically raw, unnormalised, and schema-inconsistent across providers.
Here is what that looks like in practice. A Series A lending platform integrates three open banking providers — one covering UK current accounts, one handling European credit data, one pulling business account feeds. Each provider returns transaction data in a different format: different date fields, different merchant categorisation schemes, different handling of pending versus settled transactions. A data analyst trying to calculate a 90-day average monthly credit for an underwriting model now has to manually reconcile three schemas before they can write a single SQL query. That is not analytics. That is data wrangling disguised as analytics, and it is happening across every team that has not invested in a proper open banking data layer.
The pattern we see at Fintel Analytics follows a predictable arc: fast API integration, slow data maturation. The API calls get made. The webhooks fire. The raw payloads land in S3 or a BigQuery staging dataset. And then they sit there, largely untouched by any structured modelling work, while the business continues to make credit, risk, and product decisions from spreadsheet summaries of the same data.
Over 95% of fintech startups launched in 2024 were built with at least one open banking API integration — but a far smaller proportion have built the analytics infrastructure needed to derive systematic intelligence from those integrations.

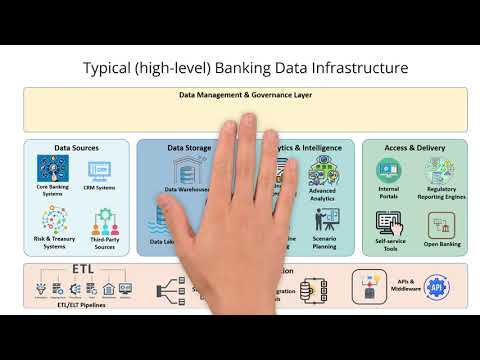
📺 Watch: How does a typical (high-level) banking data infrastructure look like?
What Does a Proper Open Banking Data Layer Actually Look Like?
A well-built open banking analytics stack has four distinct layers, and skipping any one of them creates debt that compounds fast.
Layer 1: Raw ingestion with schema versioning
Raw API payloads land in a landing zone — typically a cloud storage bucket or a raw dataset in BigQuery. The critical discipline here is preserving the original payload intact, with metadata: source provider, ingestion timestamp, API version, account identifier. Do not transform at ingestion. Transform later, with version-controlled SQL. We have seen teams lose months of historical data because they transformed in place and a provider silently changed a field name.
Layer 2: Normalisation into a canonical transaction model
This is where the real engineering work lives. Every open banking provider returns transaction data differently. Your normalisation layer — ideally built as dbt models sitting on top of the raw staging layer — maps each provider's schema to a single canonical model. That canonical model defines how a transaction is represented in your warehouse, regardless of which provider it came from. Fields like transaction_date, settled_amount, merchant_category_code, direction (credit/debit), account_id, and balance_after need to be defined once and populated consistently.
This is not glamorous work. But it is the work that makes everything downstream trustworthy. Until this layer exists, every analyst who touches transaction data is making their own schema assumptions — and those assumptions will diverge, silently, over time.
Layer 3: Enriched financial entities
Once you have a canonical transaction model, you can build the enriched models that actually power business decisions. These include:
- Account-level aggregates: Rolling 30/60/90-day income, expenditure, balance volatility, recurring payment detection
- Merchant-level models: Normalised merchant names (raw open banking merchant data is notoriously messy), category spend summaries, transaction frequency patterns
- Behavioural signals: Salary detection, overdraft frequency, gambling transaction flags, rent detection — the signals your credit or risk models consume as features
- Customer financial health scores: Composite metrics built from the aggregates above, refreshed on a defined cadence
This is where open banking data becomes intelligence. Not in the raw feed — in the modelled layer that sits on top of it.
Layer 4: Queryable data products for operational teams
The final layer is the one most teams skip entirely. Analytics models exist in the warehouse. Nobody can query them without writing SQL. The underwriting team uses a spreadsheet. The risk team manually pulls transaction summaries from the provider's own portal.
A properly built data product — a Holistics or Looker dashboard, a Metabase report, a SQL semantic layer that makes the enriched models queryable by non-technical users — closes this gap. It means your credit analysts are working from the same canonical model as your data scientists. It means your risk team has a live view of portfolio-level exposure without asking engineering to run a query.
If you are looking to design and deliver this kind of infrastructure for your fintech, explore how Fintel Analytics approaches open banking data engineering — we have built this stack for lending, payments, and account aggregation businesses across multiple markets.
The Normalisation Problem: Why Merchant and Category Data Breaks Analytics
Merchant data from open banking APIs is one of the most underappreciated sources of analytics failure in early-stage fintech. The raw merchant name field in a transaction payload is not clean. It is what the acquiring bank or card scheme passes through — often a truncated, uppercase, sometimes abbreviated version of the merchant name with a location code appended. "AMZN MKTP UK*1X3Z4" is not a useful data point for a category spend model. Neither is "TFL*TRAVEL CH LONDON" if your model needs to identify transport spend.
Most open banking providers do some level of merchant enrichment — Truelayer, Plaid, and Yapily all attempt to normalise merchant names and assign category codes. But the quality is inconsistent, the category taxonomies differ across providers, and the enrichment fails on a non-trivial proportion of transactions, particularly for smaller merchants, international transactions, or newer merchant types.
In our work with early-stage lending companies, we have seen transaction categorisation accuracy from raw open banking feeds range from around 60% to 85%, depending on the provider and the merchant mix. That gap matters enormously if your underwriting model is consuming category-level spend signals as features. A model trained on imprecise category data is a model making systematically biased decisions — and you may not discover it until your default rates diverge from your predictions.
The fix is a normalisation pipeline that sits between the raw provider data and your enriched models. It should:
- Standardise merchant names using a reference dataset or an ML-assisted matching layer
- Map provider-specific category codes to a single internal taxonomy
- Flag low-confidence categorisations for review rather than propagating bad data into your models
- Track categorisation coverage as an operational metric — not something you check quarterly, but something that fires an alert if coverage drops
For companies building credit or affordability assessment products, this layer is not optional infrastructure. It is a core input to regulatory compliance. If you are making lending decisions using transaction data, the accuracy of your categorisation directly affects the quality of your affordability assessment — and that is territory regulators will scrutinise.
For more on building the transaction data pipelines that underpin credit models, see our guide to credit risk analytics for fintech lenders.

How Should You Model Income and Expenditure From Open Banking Feeds?
Income and expenditure (I&E) modelling is the most commercially important analytics problem most open banking-powered fintechs need to solve — and it is significantly harder than it looks from the outside.
The naive approach is to sum all credits as income and all debits as expenditure. This is wrong in so many ways that it is worth enumerating them:
- Internal transfers inflate income: A customer moving money between their current account and savings account generates a credit on both sides if you have access to both accounts. Summing raw credits double-counts this.
- Salary payments are irregular in timing: Not everyone is paid on the same day of the month, not everyone is paid monthly, and some income sources (freelance payments, benefit payments, rental income) arrive at irregular intervals. A naive 30-day window misses or mis-attributes these.
- Refunds appear as credits: A large refund from a retailer looks like income in a raw credit sum. It is not.
- Loan disbursements and credit card payments distort both sides: An incoming loan drawdown is a credit. An outgoing credit card repayment is a debit. Neither is income or expenditure in the traditional sense.
A production I&E model needs to apply a classification layer on top of the canonical transaction model that handles each of these cases. This is typically a combination of rule-based logic (explicit transfer detection, payroll detection via frequency and amount pattern matching) and, at higher volumes, machine learning classifiers trained on labelled transaction data.
We rebuilt an I&E pipeline for a Series A lending platform that had been running income calculations from a manually maintained Google Sheet fed with summarised open banking data. The process took a credit analyst 45 minutes per application and produced figures that differed by 15–20% from what a properly modelled pipeline would calculate, depending on the customer's transaction profile. After rebuilding the pipeline as automated dbt models consuming the normalised transaction layer, the same calculation completed in under three seconds per customer, with materially better accuracy on irregular income patterns.
That kind of improvement compounds. When your underwriting decisions are based on better income figures, your risk model improves. When your risk model improves, your pricing tightens. When your pricing tightens, your unit economics improve.
What Open Banking Analytics Does to Your Fraud and Risk Models
Open banking transaction data is one of the richest fraud and risk signals available to fintech lenders and payments businesses — but only if it is modelled correctly. Raw feeds consumed in isolation, without enrichment and behavioural aggregation, add noise as often as they add signal.
The most useful risk signals from open banking data are not individual transactions — they are patterns across time. Overdraft frequency over the past 90 days. Variance in end-of-month balance as a proxy for financial stress. Presence of gambling merchant transactions and their share of total expenditure. Sudden changes in income source — a previously regular salary payment that stopped appearing three months ago. Presence of payday loan repayments in the debit stream.
Building these signals as first-class features in a feature store — rather than computing them ad hoc in a Jupyter notebook for each model run — is the difference between a scalable ML programme and a prototype that degrades in production. APIs feeding real-time information into AI and ML models are increasingly powering smarter decision-making in financial services. But the quality of that decision-making is entirely dependent on the quality of the feature engineering that sits between the raw API feed and the model.
For teams building or scaling fraud models on top of open banking data, see our guide to fraud analytics for fintech — specifically the section on feature pipelines and training-serving skew, which is a chronic problem when transaction features are computed differently at training time and inference time.
Frequently Asked Questions
Q: What is open banking data analytics?
A: Open banking data analytics is the practice of ingesting raw financial data from open banking APIs — transaction history, account balances, payment flows — and transforming it into structured, modelled data products that inform credit decisions, risk management, product development, and customer intelligence. It requires both data engineering (pipelines, normalisation, warehousing) and analytics (modelling, feature engineering, reporting).
Q: Why is raw open banking API data hard to analyse?
A: Raw open banking data arrives in provider-specific schemas, with inconsistent merchant naming, mixed category taxonomies, and no standardised handling of transactions like internal transfers or refunds. Without a normalisation and modelling layer, analysts waste most of their time on data wrangling rather than generating insights — and different teams working from the same raw data will produce different numbers.
Q: How should fintech startups structure their open banking data pipeline?
A: A well-structured open banking data pipeline has four layers: raw ingestion with schema versioning, normalisation into a canonical transaction model (typically in dbt), enriched financial entity models (income/expenditure, behavioural signals, risk features), and queryable data products for operational teams. Skipping the normalisation layer is the most common and most expensive mistake.
Q: Can open banking transaction data be used for machine learning models?
A: Yes — but only with proper feature engineering. The raw transaction feed is rarely directly consumable by ML models. The highest-value signals are aggregated behavioural patterns over time windows (30, 60, 90 days): income stability, overdraft frequency, spend category ratios, balance volatility. These need to be computed consistently in a feature pipeline and stored in a feature store to avoid training-serving skew.
Q: How does the scale of open banking data affect data infrastructure choices?
A: At early stage (thousands of accounts), a well-structured BigQuery dataset with dbt models is typically sufficient. At Series B scale and beyond — particularly for lenders processing hundreds of thousands of account refreshes per day — you need to consider partitioning strategies, incremental model refresh, and API call cost management. Cloud data warehouse costs can grow faster than user volumes if query patterns and model refresh frequencies are not governed carefully.
Open banking feeds are among the richest sources of financial intelligence available to fintech lenders, payments businesses, and account aggregators — but the gap between having API access and having an analytics layer that actually informs decisions is wider than most teams expect. At Fintel Analytics, we have built open banking data pipelines, canonical transaction models, and enriched feature stores for fintech businesses across lending, BNPL, and payments — from the first dbt model to production-ready data products used daily by underwriting and risk teams. If your team is ingesting open banking data but still running affordability assessments from spreadsheet summaries or ad hoc SQL, that is a solvable problem — and solving it has a direct line to better risk decisions, faster onboarding, and stronger unit economics.