 Fintel Analytics
Cross-Border Payments Analytics: Build Real Corridor Visibility
Most cross-border fintechs are flying blind on their most important metrics. Here's how to build the analytics layer that gives you real corridor visibility.
What Is Cross-Border Payments Analytics — And Why Does It Matter in 2026?
Cross-border payments analytics is the practice of building structured data models and operational dashboards that give payments businesses real-time visibility into corridor-level performance, transaction failure rates, FX cost attribution, and provider efficiency. Without it, you are running one of the fastest-growing segments in financial services entirely on instinct.
The global cross-border payments market hit $194 trillion in volume in 2024 and is forecast to reach $320 trillion by 2032 (FXC Intelligence, 2025). Yet despite that scale, most Series A and Series B fintechs we encounter cannot answer a basic question without pulling spreadsheets from three different places: Which corridor is losing us the most money right now, and why?
The operational data exists. The problem is that it sits scattered across PSP webhooks, ledger exports, FX rate feeds, and compliance logs — unmodelled, unjoined, and untrustworthy. This post explains what a proper cross-border payments analytics stack looks like, where it most commonly breaks down, and how to build something that actually holds up at scale.
Why Cross-Border Fintechs Struggle to Get Reliable Operational Metrics
The payments data problem is not a storage problem. It is a modelling problem.
Most early-stage payments companies have data — it is just fragmented across systems that were never designed to talk to one another. A typical cross-border stack at Series A might include two or three PSPs, a core ledger, a KYC/AML provider, one or more FX rate feeds, and a manual reconciliation process run out of Google Sheets. Each of these systems emits data in a different format, at a different cadence, with different identifiers for the same underlying transaction.
A pattern we see repeatedly: a company will report transaction success rates using the PSP's own dashboard — which typically counts only the requests it received, not the ones that never made it that far. Meanwhile, their internal ledger shows a different settlement figure. And their finance team is working off a third number from a manual export that was run four days ago. Leadership does not know which one to believe, so they default to whichever looks best in a board slide.
This is not a hypothetical. In our work with early-stage cross-border fintechs, the absence of a unified payments data model is almost universal below Series B. The consequence is that corridor performance decisions — which rails to route through, which providers to prioritise, which currencies to hedge — are made on incomplete or outright wrong data.
The structural challenge is real: with over 19,000 tax jurisdictions worldwide (2024 data), businesses face compliance data complexity that compounds the underlying modelling problem. Add multi-PSP routing, variable FX spreads, and differing settlement windows across corridors, and the gap between "we have data" and "we understand our operations" becomes significant.

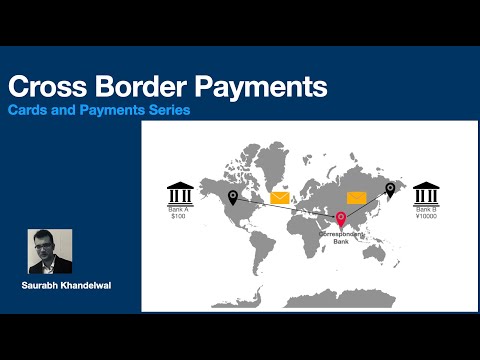
📺 Watch: Cross Border Payments | ISO 20022 | Cards and Payments - Part 16
The Five Metrics a Cross-Border Payments Analytics Stack Must Answer
Before you think about tooling, get clear on what questions your analytics layer must be able to answer. In our delivery experience, the five that matter most for a growth-stage cross-border fintech are:
1. Corridor-level success rate Not your aggregate success rate — your per-corridor success rate, split by rail, PSP, and send/receive currency pair. A 94% aggregate might mask a 78% success rate on your EUR→NGN corridor that is quietly bleeding customer trust.
2. True cost per corridor This is rarely visible without deliberate modelling. True cost per corridor means: transaction fee + FX spread cost + failure retry cost + operational overhead (manual interventions, compliance checks that triggered). Most companies only see the fee line. The FX spread is often embedded invisibly in the rate, and retry costs are never attributed back to the originating corridor.
3. End-to-end settlement latency Not "time to initiation" — time from customer submission to confirmed funds-in at the beneficiary. This requires stitching together webhook events from your sending PSP, your receiving correspondent, and your internal status engine. Without that join, you cannot measure against the G20's transparency targets, and more importantly, you cannot identify which corridor-provider combinations are creating the latency.
4. Failure classification and resolution time Failures are not homogeneous. A compliance hold, a liquidity shortage at the beneficiary bank, a technical timeout, and a rejected account number are four entirely different problems requiring four entirely different interventions. An analytics stack that just counts failures without classifying them is not actionable.
5. Provider margin and concentration risk If 70% of your GBP→PHP volume is routing through one provider, that is a risk you need to see. And if that provider's implicit margin has drifted 12 basis points over the last quarter, you need to catch that before it materially impacts your unit economics.
How to Build the Data Architecture That Powers This
This is where most companies reach for a dashboard tool before they have laid the foundation. The data architecture underneath cross-border payments analytics is non-trivial — and getting it wrong means your metrics will be consistently unreliable.
Here is the architecture we recommend for a growth-stage fintech on a modern cloud stack:
Layer 1: Raw ingestion Capture all source data in its original form — PSP webhooks, ledger entries, FX rate snapshots, compliance event logs, correspondent confirmations. The key discipline here is: do not transform at ingestion. Preserve the raw payload so you can reprocess it when schemas change (and they will). A streaming ingestion layer into BigQuery or AWS S3, triggered by webhook events and complemented by scheduled batch pulls for slower-moving systems, handles this well.
Layer 2: Staging models in dbt This is where normalisation happens. Each source system gets its own staging model that standardises identifiers, timestamps, status codes, and currency representations. This is the layer that allows you to join a PSP webhook event to a ledger entry and a KYC flag without doing it in an ad-hoc query every time. If your company has scaled faster than your data infrastructure, the raw data arriving here will need significant normalisation — inconsistent status enums, missing corridor metadata, FX rates stored as strings rather than numerics are all common.
Critically, define a canonical transaction identifier at this layer. Every system will call it something different. Your analytics layer needs one master ID that traces a transaction from initiation through to settlement confirmation, stitching together events from every system involved.
Layer 3: Core business logic in dbt mart models This is where corridor performance, cost attribution, and latency calculation live. These are your certified, tested, documented models — not ad-hoc queries. Metrics like "true cost per corridor" or "failure classification" should be computed once, in a versioned dbt model, and surfaced to every dashboard from the same source. If your failure rate dashboard and your finance reporting are pulling this differently, you have a governance problem, not a data problem.
For teams at this stage, consider pairing your dbt models with a SQL semantic layer — a single governed definition of every metric your business uses, so that "success rate" means the same thing whether your CFO is looking at it in Holistics, Looker, or a board slide export.
Layer 4: Operational dashboards The goal is not a single executive dashboard. Cross-border payments operations require role-specific views: a treasury team needs corridor liquidity and settlement windows; a compliance team needs failure classification and SAR trigger rates; an operations team needs real-time payment status and manual intervention queues; leadership needs corridor P&L and provider concentration. Each of these is a distinct data product, not a different filter on the same dashboard.
If you are looking to implement this kind of architecture in your organisation, explore how Fintel Analytics approaches payments data infrastructure — we have built this stack for cross-border payments companies across multiple corridors and currency pairs, and we know where the delivery risk sits.

Real-World: What This Looks Like In Practice
We built a corridor analytics layer for a Series A cross-border payments company that was operating across twelve send corridors with three PSPs. Before the engagement, their ops team ran a daily reconciliation process that took 30–50 minutes — a manual join of PSP exports, ledger entries, and a rate sheet — to produce a number they still did not entirely trust. By rebuilding this as an automated dbt pipeline with validated source joins, the reconciliation now completes in under three seconds, with data quality tests running automatically on every load.
More significantly, the corridor cost model they built revealed that one of their top three corridors by volume was also their worst by contribution margin — a combination of an unfavourable implicit FX spread, a high retry rate due to a poorly performing correspondent, and a disproportionate share of compliance-triggered manual holds. None of this was visible from their existing PSP dashboard. The corridor model made it visible, and within two months they had renegotiated the correspondent relationship and rerouted a proportion of volume to a better-performing rail.
A capital reconciliation project run in parallel also uncovered a discrepancy that had gone undetected — at market borrowing rates, the gap was costing over $6,000 per day. Not because of fraud or error, but because the settlement timing assumption embedded in their spreadsheet model was wrong for two of their corridors.
This is why the underlying data architecture matters. Dashboards that look clean on the surface frequently rest on modelling assumptions that have never been interrogated.
Common Failure Modes — And How To Avoid Them
We have seen cross-border analytics projects fail in predictable ways. Here are the four most common:
1. Modelling at the transaction level when you need the event level Cross-border payments are not atomic. A single customer transaction generates multiple events — initiation, compliance check, FX conversion, send confirmation, beneficiary receipt, settlement confirmation. If your data model collapses these into a single row, you lose the ability to measure latency between stages, identify which step is causing failures, and attribute cost accurately. Model at the event level; aggregate up.
2. Using PSP-reported success rates as ground truth PSP success rates reflect what the PSP saw. They do not reflect the customer experience. A payment can be "successful" by PSP definition and still result in a failed beneficiary credit three days later. Your success rate should be measured from your own data, joined from initiation to confirmed beneficiary receipt, not derived from a provider's dashboard.
3. Treating FX cost as a fixed fee FX cost in cross-border payments is dynamic and often partially implicit. If your data model treats it as a fixed percentage, your corridor cost calculations will be wrong, and wrong in a way that is directionally misleading. You need to capture the actual rate applied at transaction time, compare it to the mid-market rate at the same timestamp, and attribute the spread explicitly. This requires your FX rate feed to be ingested and joined at the transaction level, not used as an average.
4. Building analytics for leadership before building it for operations The teams that most need cross-border analytics are not in the boardroom — they are in operations, compliance, and treasury. A corridor performance dashboard built for a quarterly board review is a vanity project. Build the operational data products first: the real-time payment status feed, the failure queue with classified reasons, the settlement window tracker. Leadership reporting follows from those foundations, not the other way around.
For teams already wrestling with data quality across payment systems, our post on dbt testing strategy for startups covers the specific testing patterns that prevent bad data from reaching your corridor models.
And if your treasury team is dealing with the downstream effects of poor corridor visibility — missed funding windows, unexpected float costs, provider concentration risk — our guide to treasury analytics for fintech startups covers how to build those views on top of the same data foundations.
Frequently Asked Questions
Q: What is cross-border payments analytics?
A: Cross-border payments analytics is the practice of building structured data models and dashboards that give payments businesses visibility into corridor-level performance, transaction failure rates, FX cost attribution, and provider efficiency. It requires ingesting data from multiple source systems — PSPs, ledgers, FX feeds, compliance tools — normalising it, and surfacing operational and financial metrics from a single governed data layer.
Q: What data sources do I need for cross-border payments analytics?
A: The core sources are: PSP webhook feeds (for transaction events and status changes), your internal ledger (for settlement confirmation and float), FX rate feeds (captured at transaction time, not as daily averages), compliance event logs, and correspondent bank confirmation data where available. The complexity comes from normalising these across different schemas, timestamps, and status code conventions — which is why a dbt-based staging layer is critical.
Q: How do I measure true corridor cost in cross-border payments?
A: True corridor cost requires combining three components: the explicit transaction fee charged by your PSP or correspondent, the implicit FX spread (the difference between the rate applied and the mid-market rate at execution time), and the operational cost of failed transactions (retry fees, manual intervention hours, compliance overhead). Most companies only see the explicit fee. The spread and failure costs typically require deliberate data modelling to surface.
Q: What tools should a Series A fintech use for cross-border payments analytics?
A: A production-ready stack for a Series A fintech typically includes BigQuery or Redshift as the warehouse, dbt for transformation and business logic, a streaming or webhook-driven ingestion layer (Fivetran, Airbyte, or custom), and a BI layer such as Holistics or Looker for operational dashboards. A SQL semantic layer is important at this stage to ensure that metrics like "success rate" and "corridor margin" have single, governed definitions across all reporting surfaces.
Q: How long does it take to build a corridor analytics capability?
A: With the right architecture and team, a minimum viable corridor analytics layer — covering success rates, cost attribution, and settlement latency for your top corridors — can be delivered in six to ten weeks. The main variable is data quality at source: if PSP webhooks are unreliable or your ledger lacks transaction-level metadata, normalisation takes longer. Investing in data quality validation upfront (via dbt tests) pays back significantly in the reliability of the resulting metrics.
Cross-border payments is one of the fastest-growing segments in financial services, but it is also one of the most operationally complex — and the gap between the data you have and the visibility you need is costing you real money every day, whether that shows up as poor corridor decisions, undetected margin leakage, or a treasury team managing liquidity on four-day-old numbers. At Fintel Analytics, we have built corridor analytics infrastructure for cross-border payments companies operating across multiple currencies and rails, and we know exactly where these projects stall and what it takes to get them into production. If your operations team is still reconciling manually or your leadership is making routing decisions without reliable corridor data, that is a problem with a concrete, deliverable solution.