 Fintel Analytics
BNPL Analytics: Build Risk & Performance Intelligence in 2026
BNPL platforms generate complex, high-velocity data that most early-stage teams are not equipped to model. Here is how to build the analytics infrastructure that actually scales.
BNPL analytics for fintech teams means building a data infrastructure that can model repayment behaviour, detect loan stacking in near real-time, and give leadership a single, trustworthy view of credit performance — all before the portfolio grows large enough to make bad decisions expensive. Without it, you are flying blind at precisely the moment underwriting risk is highest.
The scale of the BNPL market makes this an urgent engineering problem, not a future one. The global BNPL market reached approximately $560.1 billion in GMV in 2025, a 13.7% year-over-year increase. Global BNPL users reached approximately 380 million in 2024 and are projected to grow toward ~670 million by 2028. Behind those numbers is a data challenge that most growth-stage BNPL platforms are seriously underestimating: high-frequency transaction events, multi-provider loan stacking, and a delinquency signal that is far noisier than a traditional credit portfolio.
BNPL default rates remain relatively low at around 1.8–2%, but approximately 34–41% of users report making at least one late payment — highlighting the gap between short-term delinquency and actual defaults. That gap is where analytics earns its keep. If your data infrastructure cannot distinguish a borrower who paid two days late from one actively stacking four BNPL plans simultaneously, your risk models are working with the wrong inputs.
This post is written for founders, heads of data, and risk leads at BNPL platforms and embedded finance companies who are scaling faster than their data stack. We will cover what breaks first, what to build, and what the team looks like when it is working properly.
Why Does BNPL Data Break Earlier Than Other Fintech Stacks?
BNPL generates a specific category of data problem that traditional lending analytics tools are not designed for. The repayment schedules are short (typically four instalments over six weeks), the transaction volume is high, and the credit assessment window is close to zero — decisions are made at the point of checkout, not over a multi-day underwriting cycle.
In our work with early-stage BNPL and embedded finance companies, a pattern appears almost every time: critical risk calculations are living in spreadsheets. A finance analyst maintains a Google Sheet that pulls from a Postgres export, applies a series of hand-coded formulas to classify delinquency buckets, and sends it to leadership on a Monday morning. It takes forty-five minutes to run and produces a number nobody is entirely confident in. The moment that analyst is on leave, the number does not get produced at all.
This is not an edge case. It is the default state for any BNPL operation that has grown faster than its data team. The operational consequences compound quickly:
- Repayment cohort analysis is approximate. Without proper cohort modelling in a semantic layer, repayment curves are eyeballed rather than measured. Day-7 and Day-14 repayment rates — the leading indicators that matter most for early default detection — are not consistently tracked.
- Loan stacking is invisible. 60% of BNPL users hold multiple loans at the same time, and many of those are spread across different providers with no cross-bureau visibility. Without modelling application velocity and behavioural signals at the borrower level, stacking goes undetected until the first missed payment.
- Provider-level cost of capital is opaque. BNPL platforms typically fund instalments through a combination of bank lines, capital markets facilities, and institutional investors. If the treasury team cannot see utilisation rates and repayment inflows by funding tranche, they are managing capital allocation on guesswork.
Investors are increasingly concerned that standard tools like FICO scores and debt service coverage ratios may not be effectively capturing potential stress in BNPL portfolios — the concern being that BNPL could become a "masking force" of true consumer credit quality. That concern lands squarely on the data team. The answer to it is not a better model. It is a more reliable, better-governed data foundation.

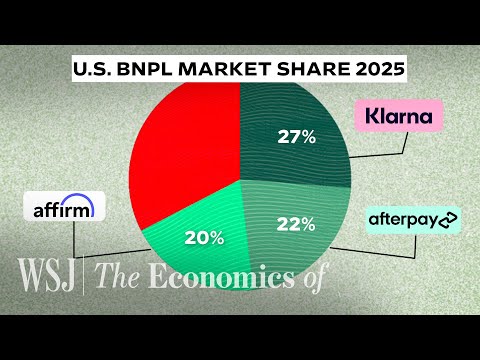
📺 Watch: How ‘Buy Now, Pay Later’ Makes Billions From ‘Free’ Loans | WSJ The Economics Of
What Does a Production-Grade BNPL Analytics Stack Actually Look Like?
The architecture for a BNPL data stack needs to solve three distinct problems simultaneously: operational speed (risk decisions need near-real-time signals), analytical depth (cohort and vintage analysis requires full history), and governance (every metric used in an investor pack or a regulatory return needs a documented, auditable lineage).
The stack we typically deliver for a Series A BNPL company follows this pattern:
Ingestion layer. Raw events — loan originations, instalment schedules, payment attempts, successes, failures, refunds — land in a cloud data warehouse (BigQuery is our default for this class of company, for reasons of cost predictability and SQL-native tooling). Source systems are typically a core lending platform (often Mambu or a custom-built origination engine), a PSP for payment execution, and a bank account data enrichment provider. Each of these produces a different schema, different event granularity, and different latency characteristics. Normalising them before they touch any analytical model is non-negotiable.
Transformation layer. dbt sits here. Every loan, every instalment, every payment event is modelled into a clean, tested, documented set of tables. The key entities are: loans, instalments, payments, borrowers, and cohorts. Business logic — what counts as a late payment, how delinquency buckets are assigned, what constitutes a complete repayment — lives in dbt models, not in BI tool expressions or analyst spreadsheets. The distinction between a 34–41% late payment rate and a 1.8–2% charge-off rate is precisely the kind of definitional complexity that needs to be encoded in a governed transformation layer, not left to individual analysts to interpret.
We have seen this transformation work pay immediate dividends. Migrating delinquency classification logic from spreadsheets into dbt models eliminated a recurring class of calculation errors and cut weekly reporting maintenance time by over thirty minutes for one client's risk team — time that was previously spent reconciling conflicting numbers before the Monday risk review.
Semantic layer. Metrics — cohort repayment rates, delinquency by vintage, funding utilisation, instalment-level cash flows — are defined once in a SQL semantic layer and served consistently to every downstream consumer. Whether the CFO is looking at a Holistics dashboard or the risk team is querying directly, the number they see has the same definition, the same lineage, and the same result. This is not a luxury for a BNPL platform; it is table stakes for investor credibility and regulatory readiness.
If you are assessing where your current stack stands against this pattern, explore how Fintel Analytics approaches BNPL and payments data infrastructure — we work with growth-stage fintech companies globally to design and deliver exactly this kind of solution.
How Do You Build Repayment Cohort Models That Actually Work?
Cohort analysis is the most important analytical tool in a BNPL company's arsenal, and it is also the most commonly broken. The failure mode is almost always the same: cohorts are defined by calendar month of origination, repayment data is pulled on a single snapshot date, and the resulting table is presented as a repayment curve — when it is actually a point-in-time slice that conflates loans at different stages of their repayment lifecycle.
Proper BNPL cohort modelling requires:
- Origination-relative timing. Every data point in the cohort model should be expressed as "days since origination" or "instalment number", not calendar date. This allows you to compare the repayment behaviour of a January cohort to an August cohort on a like-for-like basis — critical for detecting seasonal effects and underwriting drift.
- Instalment-level granularity. Aggregating to loan level hides the signal. A borrower who missed instalment 2 but caught up on instalments 3 and 4 has a fundamentally different risk profile from one who missed all four. Your models need to track repayment at the instalment level and roll up, not start at the loan level and drill down.
- Forward-looking completion rates. The most useful cohort metric for a BNPL platform is not the historical repayment rate — it is the projected completion rate for loans still in flight, adjusted for instalment-level delinquency signals observed so far. This requires a simple but carefully governed model that combines observed payment behaviour with historical cure rates by delinquency bucket.
We have seen this matter dramatically in practice. A capital reconciliation project we delivered for a Series A lending platform uncovered a $25M discrepancy in their reported portfolio balance that had gone undetected in their existing reporting — at market borrowing rates, that gap was costing over $6,000 per day. The root cause was a cohort calculation that was using snapshot-date balance figures rather than origination-relative accounting. The fix was not a better model; it was governed SQL logic replacing an inherited spreadsheet.
For further background on the principles of cohort modelling for startups, including the most common ways the numbers mislead, see our post on cohort analysis for startups.

How Should BNPL Teams Approach Real-Time Risk Signals?
The challenge with real-time risk in BNPL is not that the data does not exist — it is that it exists in the wrong places, at the wrong latency, with no consistent definition applied to it.
BNPL regulation will take effect under FCA oversight beginning July 2026, introducing stricter creditworthiness assessments, clearer disclosures, and consumer protection requirements. The revised Consumer Credit Directive across EU member states is formally bringing BNPL under regulated credit frameworks, including affordability checks and standardised disclosures. Both of these developments require BNPL platforms to demonstrate that their affordability assessments are based on documented, reproducible logic — not ad-hoc queries run by an analyst the night before a regulatory review.
The practical response to this pressure is not to build a real-time ML scoring pipeline on day one. Most Series A BNPL platforms do not need one. What they do need is:
- A near-real-time delinquency feed. Payment events from the PSP should land in the warehouse within minutes, not hours. The transformation models that classify instalment status should run on a scheduled refresh of no more than thirty minutes. This gives the risk team an actionable view of today's delinquency picture without requiring a streaming architecture they are not staffed to maintain.
- Application velocity monitoring. A simple model that flags borrowers who have submitted more than N applications in the last M days — across your own book, where you have the data — is one of the highest-signal early warning indicators for stacking behaviour. This does not require external bureau data to be useful. It requires a clean, deduplicated borrower entity in your data warehouse.
- Automated alerts on threshold breaches. Day-7 repayment rate drops below target for a given origination channel? Funding utilisation crosses 85%? An automated alerting system built on your data warehouse — we typically implement this with dbt exposures feeding a Holistics alert — gives the risk and treasury teams real-time visibility without requiring anyone to check a dashboard manually.
An automated alerting system of this kind gave one treasury team real-time visibility into provider risk for the first time, reducing funding misses and giving leadership a quantifiable measure of capital efficiency. That is not a sophisticated ML project. It is disciplined data engineering applied to the right problem.
For teams building the underlying credit risk framework, our post on credit risk analytics for fintech lenders covers the modelling principles in more depth.
What Does the BNPL Analytics Team Actually Need to Look Like?
A pattern we see repeatedly with early-stage BNPL platforms is an analytics team that is either too thin or misaligned to the actual problem. The typical configuration is one data analyst who owns all reporting, no data engineering capacity, and a set of models that exist entirely in the BI tool's expression layer. This works until the portfolio reaches a scale where reporting latency, metric inconsistency, or investor scrutiny makes it unworkable — usually somewhere between £10M and £50M in annualised GMV.
The right team shape for a Series A BNPL company is:
- One analytics engineer (not a pure analyst, not a pure engineer — someone who can write production dbt models and understands credit risk concepts well enough to translate them into SQL logic)
- One BI-focused analyst who owns the dashboards, owns the relationship with risk and finance stakeholders, and is responsible for the accuracy of the numbers those teams use to make decisions
- A fractional or embedded data engineering resource who owns the ingestion layer, the warehouse configuration, and the query performance governance that prevents cloud costs from tripling quarter-on-quarter as the loan book grows
Many Series A BNPL teams are not ready to hire all three of those roles. That is exactly where an embedded partner — one who has delivered this architecture before and can move quickly — adds more value than a full hire. The goal is not a perfect team. It is a working stack, governed metrics, and a set of dashboards that leadership trusts enough to make decisions from.
Payment value growth in the BNPL sector is decelerating from 27.1% in 2024 to 14.0% in 2026 — which means the era of growth covering up operational inefficiency is ending. The BNPL companies that will scale profitably are the ones that know their numbers.
Frequently Asked Questions
Q: What data should a BNPL platform prioritise tracking from day one?
A: The four most important data assets are: loan originations (with full borrower and channel attribution), instalment schedules (with origination-relative timing), payment events (success, failure, late, and partial at the instalment level), and application history (for velocity and stacking detection). These four tables, cleanly modelled in a data warehouse, give you 90% of the analytical capability you need at Series A. Build the governance around them early — retrofitting it later is painful.
Q: How do I define "delinquency" consistently across my BNPL dashboards?
A: Define it once in a dbt model and nowhere else. The most common failure is allowing the BI tool, the risk spreadsheet, and the finance report to each apply their own delinquency classification rules. Agree on the definition with your risk and finance stakeholders (typically: one day past due, 7 days past due, 30 days past due, and written off), encode it in a tested dbt model, and point every downstream consumer at the same output table. This is the single most impactful governance decision a BNPL analytics team can make.
Q: What is the right architecture for BNPL cohort analysis?
A: Use origination-relative timing (days or instalments since origination, not calendar date), model at instalment level not loan level, and build forward-looking completion rate projections that incorporate observed delinquency signals. Store the cohort spine as a dbt model, not as a BI tool calculation — this ensures it can be queried by analysts, audited by investors, and reused across multiple dashboards without definition drift.
Q: How does BNPL analytics differ from traditional consumer lending analytics?
A: Three key differences: the decision window is near-zero (checkout-time), the repayment cycle is very short (typically six weeks), and the delinquency signal is noisier relative to actual default. This means you need higher-frequency data refreshes, instalment-level granularity rather than loan-level aggregation, and leading indicators (Day-7 repayment rate, application velocity) rather than the lagging indicators (30-day delinquency, charge-off rate) that traditional lending analytics relies on.
Q: When does a BNPL startup need a proper data warehouse?
A: Earlier than most founders think. If your risk or finance team is maintaining a spreadsheet that produces a number used in any decision — underwriting policy, investor reporting, capital allocation — you already need a data warehouse. The threshold for BNPL is lower than for most fintech models because the data velocity is higher, the regulatory exposure is growing, and the cost of a bad number in a risk model is immediate and material.
Building reliable analytics for a BNPL portfolio is not primarily a machine learning problem — it is a data engineering and governance problem that compounds in cost the longer it goes unsolved. At Fintel Analytics, we have helped payments and lending companies build exactly this kind of infrastructure: clean ingestion pipelines, governed dbt transformation layers, and real-time risk dashboards that give leadership the confidence to make decisions on live data rather than last Monday's spreadsheet. If your team is scaling a BNPL book without a data stack that matches your risk exposure, that is a fixable problem — and fixing it early is materially cheaper than fixing it after an investor or regulator asks the question first.