 Fintel Analytics
Settlement Timing Analytics: Fix Your Post-Trade Data Stack
Settlement timing analytics tell you exactly where your post-trade process breaks down — before regulators or counterparties do. Here is how to build the data stack that survives T+1.
Settlement timing analytics is the discipline of measuring, monitoring, and diagnosing the full lifecycle of a trade or payment from execution through to final settlement — so you can detect failures, quantify latency, and fix root causes before they cost you money or regulatory goodwill. For a fintech operating across multiple rails and counterparties, this is not an optional capability. It is the difference between knowing your settlement exposure at 9 AM and discovering it at 4 PM when a correspondent is already chasing you.
The urgency has never been higher. Capital markets representing the majority of global market capitalisation have already shifted to T+1, and the EU and UK are on a defined path to follow. Meanwhile, instant payment rails are handling volumes that dwarf what existed five years ago. The back-office data infrastructure that underlies post-trade operations at most growth-stage fintechs was never built for this pace — and the gap is widening fast.
Why Do Fintech Teams Struggle to See Settlement Timing in Real Time?
The honest answer is that settlement data is structurally fragmented. You have execution data sitting in one system, custodian confirmation data arriving on a delayed file, nostro balances in a treasury system that updates nightly, and an FX provider feeding a separate API. None of these speak the same language, use the same timestamps, or agree on what "settled" actually means.
A pattern we see repeatedly in our work with early-stage fintechs: the team believes they have settlement visibility because they have a daily reconciliation report. What they actually have is a 24-hour lag on failure detection, a process that runs in a spreadsheet owned by one person, and zero ability to distinguish between a settlement that is genuinely pending and one that has quietly failed. Those are not the same problem, and treating them as one is how discrepancies compound undetected.
The rails now settle in seconds; the back office still runs on a nightly file. That mismatch is where settlement risk lives — and where settlement timing analytics is designed to close the gap.
Achieving T+1 readiness requires intraday trade confirmation, reconciliation, and settlement coordination between brokers, custodians, and depositories. The compressed timeline leaves no room for the overnight buffers traditional processes relied on — any delay in confirmation, reconciliation, or data handoff immediately increases settlement risk.
For a Series A fintech processing payments across four corridors with three settlement partners, that is not a theoretical risk. It is a daily operational reality.

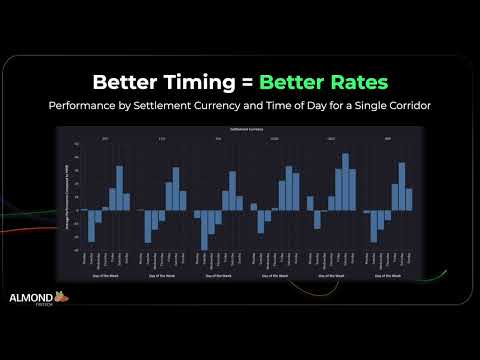
📺 Watch: Timing is Everything in Cross-Border FX Routing | Almond Fintech
What Does a Settlement Timing Analytics Stack Actually Look Like?
Building real visibility into settlement timing requires solving four distinct data engineering problems. Each one is achievable. Together, they produce a post-trade data layer that gives your treasury, operations, and finance teams the same ground truth.
1. Unified event ingestion
Every settlement-relevant event — execution, confirmation, instruction, settlement, nostro credit, reconciliation match — needs to land in a single schema with a consistent timestamp taxonomy. The moment you are comparing an execution timestamp from your OMS against a settlement timestamp from a custodian file that arrived with a different timezone offset and no millisecond precision, you are already producing unreliable latency figures.
In practice this means building ingestion pipelines that normalise each source's timestamp format into a canonical UTC-aligned event model before anything hits your warehouse. On BigQuery, this typically lives in a raw layer managed by dbt, with a staging model that resolves timezone ambiguities, strips duplicate events, and enforces field-level not-null contracts on the fields that settlement logic depends on.
2. Settlement lifecycle modelling
Once events are normalised, you model the lifecycle explicitly. A settlement has a defined set of states — instructed, matched, pending, settled, failed, cancelled — and a defined set of expected transitions between them. The job of your dbt model layer is to reconstruct the current state and the full history of state transitions for every settlement obligation you hold.
This is where most teams shortcut and pay for it later. They track the final state but not the transition history, which means they cannot answer questions like: at what point did this settlement fail? How long was it in a pending state before it became a fail? Was the failure due to a data mismatch, a funding gap, or a custodian error? Without state transition history, you are debugging settlement failures from memory instead of data.
3. Latency measurement and benchmarking
With lifecycle states modelled correctly, you can now measure actual settlement latency per corridor, per counterparty, per instrument class, and per rail. This is where settlement timing analytics becomes genuinely operational rather than just retrospective.
The metrics that matter:
- Instruction-to-match latency: how long between sending a settlement instruction and receiving a matched confirmation
- Match-to-settlement latency: how long between match and final settlement credit
- Fail rate by corridor: what percentage of instructions are resulting in fails, segmented by counterparty and reason code
- Exception age: for open fails, how long have they been open and what is the exposure value
Expose these metrics in a Holistics or Looker dashboard that refreshes intraday, and your operations team has a live heat map of where their settlement bottlenecks sit — not a spreadsheet they update manually at end of day.
4. Automated alerting on breaches
Latency metrics are only useful if someone sees them before a problem escalates. The final component of a working settlement timing analytics stack is an alerting layer that fires when a settlement obligation has been in a non-terminal state longer than its expected timeline, or when a fail rate for a specific corridor breaches a threshold.
We built this for a fintech treasury team using a combination of BigQuery scheduled queries and a lightweight notification layer. The first time it fired on a real exception — a funding shortfall that had gone undetected for six hours — the head of treasury described it as the first time they had felt genuinely in control of their settlement exposure.
If you want to understand how Fintel Analytics structures this kind of end-to-end post-trade data layer, explore our services — we have delivered this architecture for payments businesses operating across multiple rails and settlement partners globally.
What Does Settlement Failure Actually Cost You?
Fail rates are a risk most fintechs systematically underestimate because the cost is diffuse — spread across penalty fees, operational time, funding opportunity cost, and regulatory exposure rather than sitting in a single budget line.
The failure rate across all payment types is estimated to be between 1% and 2% — a figure that sounds small until you apply it to a fintech processing tens of thousands of transactions per day. At that scale, a 1% fail rate is hundreds of failed settlements daily, each one requiring manual investigation, counterparty communication, and reconciliation remediation.
Firebrand Research's analysis reveals the scale of industry-wide issues that have resulted in US$914.7bn in the form of regulatory penalties and resolution measures across the capital markets sector — a figure that illustrates just how expensive systematic settlement inefficiency becomes at scale.
For cross-border flows the picture is sharper still. Around 15% of cross-border payments fail because of currency conversion issues or incompatible payment methods — a failure rate that makes corridor-level analytics not optional but essential for any fintech with meaningful international volume.
In our own delivery work, a capital reconciliation project we ran for a global fintech uncovered a $25M discrepancy that had gone undetected across settlement accounts. At market borrowing rates, that gap was costing over $6,000 per day. The discrepancy was not caused by a rogue transaction — it was caused by inconsistent settlement state modelling across two systems that had been running in parallel without a unified reconciliation layer between them. This is exactly the kind of silent, compounding cost that settlement timing analytics is designed to surface.
The regulatory dimension adds urgency. Capital markets representing 60% of global market capitalisation have already shifted to T+1, making European adoption a competitive necessity as much as a regulatory requirement. With the EU T+1 Industry Committee designating 2026 as the investment phase and 2027 as the testing phase, the window for firms to build and validate their reconciliation infrastructure is effectively open now.
HM Treasury intends to legislate for T+1 as the standard UK settlement cycle from October 2027. The FCA expects firms to have completed project plans, secured budget, made system changes and be ready to test by the end of 2026.
For any UK or EU-regulated fintech, that is not a future deadline. That is a build window that is already running.

How Do You Prioritise Which Settlement Flows to Instrument First?
Not every settlement flow carries equal risk or equal analytical complexity. The sequencing decision matters — you want to get signal fastest from the places where failures hurt most.
A practical prioritisation framework we use with clients:
Tier 1 — Instrument immediately: Any settlement flow where a failure creates a direct funding gap (i.e., you have already paid out and are waiting on inbound settlement), any corridor with a historical fail rate above 0.5%, and any flow that is subject to regulatory reporting or penalty regimes under CSDR or equivalent.
Tier 2 — Instrument within 90 days: Cross-border flows with multi-leg settlement chains, flows touching more than two counterparties, and any settlement that currently relies on a manually operated spreadsheet or email-based exception process.
Tier 3 — Instrument in the next cycle: Domestic flows with low volume, low value, and a clean historical record — but do not leave these uninstrumented indefinitely. Once your Tier 1 and 2 flows are visible, the marginal cost of adding Tier 3 is low.
Within compressed settlement cycles, firms must place data orchestration and automation at the centre of their post-trade operating model. This includes ingesting data from multiple sources, normalising it into consistent structures, applying match logic in near real time, and automating exception handling to resolve issues as they arise.
The sequencing above is not about deprioritising lower-risk flows. It is about ensuring that the highest-value instrumentation goes live before it is needed — rather than after a fail has already hit your P&L.
For fintechs with intraday liquidity exposure, settlement timing analytics connects directly to funding decisions. The real-time visibility this creates is closely related to what we cover in our post on intraday liquidity analytics for fintech — the two capabilities compound when they share the same underlying data layer.
What Are the Most Common Technical Mistakes in Settlement Timing Analytics?
Having built these systems across multiple fintech clients, the mistakes that cause the most damage are predictable — and entirely avoidable.
Trusting source system timestamps without validation
Different systems record event timestamps at different points in the processing chain. A custodian may timestamp a settlement at the point the instruction was received, not at the point it was matched or settled. If you ingest that timestamp and treat it as settlement time, every latency calculation you produce is wrong. Always model what a timestamp means, not just what it says.
Modelling settlement state as a binary
Treating settlement as "settled" or "not settled" loses all the diagnostic value. A settlement that has been in "pending" state for 47 hours looks identical to one that entered pending state 4 minutes ago in a binary model. State history — with transition timestamps — is the only data structure that lets you triage exceptions by urgency.
Running reconciliation as a batch job you never alert on
A reconciliation process that runs overnight and dumps results into a spreadsheet is not settlement visibility. It is a historical log. You need the reconciliation logic running continuously — or at minimum every 15-30 minutes during settlement windows — with exceptions surfaced to operations staff in real time. A reconciliation process we rebuilt for one client had been running as a manual 30-50 minute exercise each morning. Rebuilt as an automated SQL pipeline, it now completes in under 3 seconds and runs every 20 minutes throughout the trading day.
Mixing settlement currencies in latency calculations without FX normalisation
When you are measuring fail exposure across a multi-currency book, aggregating raw values without normalising to a reporting currency produces exposure figures that are arithmetically correct but economically meaningless. Build FX normalisation into your dbt models — using a daily rate table at minimum, an intraday rate feed if your exposure justifies it.
No lineage between your settlement model and your financial close
Settlement timing data should flow directly into your period-end reconciliation and financial reporting. If your settlement analytics stack and your finance data stack are separate silos, you will spend the last week of every month manually reconciling between them. The right architecture has a single data model that serves both operational monitoring and period-end reporting — with the same logic, the same definitions, and the same source of truth.
For context on how settlement data connects into broader payment operations intelligence, the post on payment operations analytics covers the operational layer that sits alongside these settlement-specific flows.
Frequently Asked Questions
Q: What is settlement timing analytics in fintech?
A: Settlement timing analytics is the measurement and monitoring of the end-to-end lifecycle of a trade or payment — from execution instruction through to final settlement confirmation. It uses data pipelines and modelling to track settlement state, measure latency by corridor and counterparty, identify fail rates, and alert operations teams to exceptions before they escalate into funding gaps or regulatory breaches.
Q: How does settlement timing analytics support T+1 readiness?
A: T+1 settlement compresses the window available for confirmation, matching, and reconciliation to a single business day. Settlement timing analytics provides the intraday visibility needed to detect mismatches and exceptions in time to resolve them — rather than discovering failures after the settlement window has closed. Firms without real-time settlement data instrumentation face materially higher fail rates under T+1 conditions.
Q: What data sources feed a settlement timing analytics stack?
A: The core sources are: execution or order management system event logs, custodian and CSD confirmation files, nostro and vostro ledger data, FX rate feeds, counterparty fail reason codes, and treasury or cash management system positions. Normalising these into a unified event model with consistent timestamps is the foundational data engineering challenge.
Q: Can a growth-stage fintech build settlement timing analytics without a large data team?
A: Yes, but the architecture choices matter. A well-structured BigQuery + dbt stack with a focused set of dbt models covering settlement lifecycle states and a Holistics or Looker dashboard layer can be built and maintained by a small team — or delivered by an external specialist. The key is scoping to the highest-risk flows first rather than trying to instrument everything simultaneously.
Q: What is a realistic benchmark for settlement fail rates?
A: Industry data suggests overall payment failure rates of 1-2% across all payment types, with cross-border flows significantly higher — some corridor-level estimates reach 15% due to currency conversion and incompatible rail issues. For fintechs operating under CSDR or T+1 regimes, the target should be a monitored fail rate with documented root cause analysis for every exception, not just a headline percentage.
Settlement timing is one of the most consequential data problems a growth-stage fintech can face — silent, compounding, and invisible until it isn't. At Fintel Analytics, we have helped fintech and payments businesses build the post-trade data infrastructure to turn settlement visibility from a manual, lagging process into a real-time operational capability — from data modelling and pipeline architecture through to live dashboards and automated exception alerting. If your team is currently relying on overnight reconciliation files or spreadsheet-based settlement tracking, the gap between what you can see and what is actually happening in your settlement book is almost certainly larger than you think.