 Fintel Analytics
Payment Operations Analytics: Fix Blind Spots in 2026
Most fintech ops teams fly blind on the metrics that matter most — settlement timing, PSP cost efficiency, and reconciliation breaks. Here is how to fix that with a proper payment operations analytics layer.
What Is Payment Operations Analytics — and Why Does It Break?
Payment operations analytics is the discipline of building a unified data layer across your payment infrastructure — PSPs, acquirers, internal ledgers, and banking partners — so that your ops, finance, and product teams can monitor settlement timing, PSP cost efficiency, reconciliation exceptions, and routing performance in real time, not after the fact. Most early-stage fintechs do not have one. What they have instead is a patchwork of PSP dashboards, manually maintained spreadsheets, and finance reports that nobody fully trusts.
The gap is expensive. When your payment operations team cannot see where transactions are settling late, which processor is underperforming, or how much your actual per-transaction cost compares to contracted rates, you are not managing your payment stack — you are reacting to it. This post lays out exactly what payment operations analytics looks like in practice, what breaks without it, and how to build the data layer that gives your team genuine visibility.
Why Most Fintech Ops Teams Are Flying Blind
Here is the pattern we see repeatedly with Series A and Series B fintechs that come to us for help: the payment infrastructure works well enough to process transactions, but the data infrastructure that should sit on top of it simply does not exist in any meaningful form.
Dependence on manual, spreadsheet-based payments remains shockingly widespread. Kani's Payments Reconciliation & Reporting Survey 2025 found that spreadsheet-based processes were still a cornerstone for 56% of the 250 UK payments businesses surveyed, with 94% of those struggling to meet reporting deadlines. That is not a small or edge-case problem — that is the industry norm, at scale, among businesses that are actively processing payments commercially.
The reason it persists is structural. Many fintechs focus on creating a frictionless front-end experience for customers, often overlooking the complex systems required to support it. The back office — particularly financial reconciliation and settlement — is usually treated as an afterthought. This approach creates significant risks, including financial errors, regulatory non-compliance, and operational bottlenecks that inhibit growth.
What makes this worse at growth stage is velocity. When you are processing thousands of transactions a day across multiple PSPs, currencies, and geographies, the volume of data your ops team needs to interrogate multiplies faster than the team itself. Manual processes that "worked" at £500k monthly volume collapse at £5M. The spreadsheet that two people could maintain between them becomes a four-person job that nobody does correctly — and by the time leadership notices, the errors have compounded for months.
The practical symptoms your team will recognise:
- Settlement reports from your PSP do not match your internal ledger, and nobody knows why without hours of manual investigation
- Finance reports a different revenue figure than ops, and both are sourced from the same transactions
- PSP costs are tracked at the invoice level, not at the transaction level, so you cannot see which routing decisions are expensive
- Exception handling is reactive — you find out about failed batches when someone raises a ticket, not when the exception occurs
- Reporting for investors or regulators requires a week of manual effort every month
Each of these is a data architecture problem, not a people problem. The fix is building the right analytics layer — not hiring more operations staff to manually compensate for the absence of one.

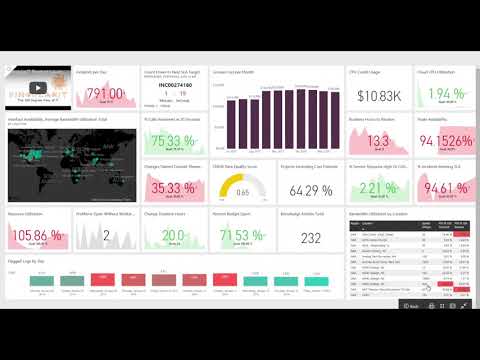
📺 Watch: Amazon EC2 Billing & Operations Analytics Product Launch
What Good Payment Operations Analytics Actually Looks Like
A proper payment operations analytics layer is not a single dashboard. It is a set of interconnected data models that bring together every data source your payment stack touches, normalise them into a consistent schema, and surface metrics that your finance, ops, and product teams can actually use without engineering support.
In practice, this means:
1. A centralised transaction ledger built in your data warehouse Every transaction from every PSP, every bank feed, every internal ledger entry lands in BigQuery or Redshift and is normalised into a single schema. This is the foundation. Without it, every team is working from a different data source with different field names, different timestamp conventions, and different currency handling — which is exactly why you get different revenue numbers from finance and ops.
2. dbt models that encode your business logic Raw PSP data is not useful as-is. You need dbt transformation layers that apply your fee structures, your routing logic, your entity hierarchy, and your reconciliation rules as reproducible SQL models — not as formulas buried in spreadsheets. When those rules change, you update the model, not seventeen Excel files.
3. Settlement timing models For every transaction, you should know: when did it occur, when did it settle, how long was the float, and was that within the contracted settlement window? Earlier, most payment systems relied on batch processing and delayed settlement, which created liquidity gaps and required manual reconciliation. As digital commerce grows, users expect immediate confirmation and access to funds. Your analytics layer needs to reflect this — modelling settlement timing at the transaction level, not just at the batch level, so you can identify where delays are occurring and quantify the liquidity cost.
4. PSP cost intelligence at the transaction level Aggregated invoice-level cost tracking is not cost intelligence. You need to know your effective rate per transaction type, per currency, per PSP, per card category. Only then can you make routing decisions that are actually optimised for cost — and verify that your contracted rates are being applied correctly.
5. Reconciliation exception pipelines Rather than discovering breaks during the monthly close, your analytics layer should surface reconciliation exceptions in near real-time: transactions that appear in one source and not another, amounts that do not match within acceptable tolerance, settlement batches that have not cleared within the expected window. These become alerts, not surprises.
6. Operational dashboards for each function Finance needs a settlement view. Ops needs an exception management view. Product needs a transaction success rate view. Leadership needs a cost-per-payment and margin view. Each of these is a different cut of the same underlying data — which is exactly why a shared semantic layer matters so much. One set of defined metrics, surfaced differently depending on who is looking at it.
If you want to understand how this kind of architecture connects to your broader payments intelligence strategy, explore how Fintel Analytics designs and delivers these solutions — we have built exactly this kind of stack for growth-stage fintechs across multiple geographies.
The Real Cost of Not Having This — With Numbers
The absence of payment operations analytics is not a neutral position. It has a quantifiable cost, and in our experience it tends to be significantly larger than the cost of building the analytics layer itself.
According to Forwardly's research, businesses spend up to 15 hours per week on payment reconciliation, depending on transaction volume. For growing PSPs and fintechs, that number balloons quickly. Nearly 30% of finance professionals' time is spent on manual reconciliation — work that is repetitive, error-prone, and completely disconnected from strategy.
If you are paying a finance analyst £80,000 a year, roughly £24,000 of that salary goes toward manual spreadsheet data entry. Multiply that across a five-person team, and you are effectively spending £120,000 annually on low-value work. That is before you account for the cost of errors.
Automated reconciliation reduces errors by 95%, saving approximately $14,250 annually in error remediation for a typical mid-size operation — and that is only the directly attributable remediation cost. It does not capture the cost of decisions made on bad numbers, or regulatory exposure from reporting errors.
The systemic risk can be even more significant. The collapse of a fintech intermediary underscored the critical need for accurate and transparent transaction-level reconciliation. Banks that supported fintech companies used the intermediary's software to track and allocate payments, but its failure to do this properly resulted in a shortfall of up to $95 million between bank-held funds and amounts owed to fintech end users. The intermediary filed for bankruptcy in April 2024, leaving behind a massive reconciliation dilemma. This is an extreme case, but the underlying mechanics — unreconciled transactions accumulating invisibly until the gap becomes unfixable — are present in less dramatic form at almost every fintech that runs payment operations on spreadsheets.
In our own delivery work, we have seen this play out directly. A capital reconciliation project we ran for a global fintech uncovered a $25M discrepancy that had gone entirely undetected — at market borrowing rates, that gap was costing over $6,000 per day. Separately, a reconciliation process that had been taking 30–50 minutes to run manually was rebuilt as an automated SQL pipeline that now completes in under 3 seconds. The value of that change is not just time saved — it is the ability to run reconciliation continuously rather than once a day, which means exceptions are caught hours earlier.
How to Build the Data Architecture: A Practical Framework
For a Series A or Series B fintech building this from scratch, here is the architecture sequence that actually ships in a reasonable timeframe:
Phase 1 — Ingest and normalise (weeks 1–4) Connect every data source: PSP settlement files (Stripe, Adyen, Checkout, Worldpay, or whichever combination you run), bank feeds, your internal transaction database, and any FX rate feeds you rely on. Land all of this in your data warehouse — BigQuery is the right choice for most growth-stage companies because of its cost model and query performance at this scale. Do not try to normalise in the source — land raw, then transform.
Phase 2 — Build core dbt models (weeks 3–8) This is where the logic lives. Build staging models that clean and type each source. Build intermediate models that join PSP data to internal records and apply your fee logic. Build mart models that expose clean, documented metrics — effective rate per transaction, settlement lag by PSP, daily reconciled volume, exception count by type. Each model is tested. Each metric has a definition. This is your semantic layer.
Phase 3 — Surface dashboards and alerts (weeks 6–10) With clean models in place, your BI layer is straightforward. Holistics BI is our default recommendation here — it connects directly to BigQuery, supports semantic model definitions that prevent metric inconsistency across dashboards, and gives finance and ops teams self-service access without requiring SQL knowledge. Build one dashboard per function (finance, ops, product, leadership), connected to the same underlying models. Then build alerting: any exception that crosses a threshold triggers a notification to Slack or email, not a monthly discovery.
Phase 4 — Operationalise and govern (ongoing) Schedule dbt runs on a cadence appropriate to your settlement cycle — typically hourly for intraday visibility. Document every model. Set up data quality tests so that if a PSP changes a field name in their export (it happens), you know immediately rather than after three weeks of silently wrong data. Assign metric ownership so that when the definition of "net revenue" changes, it changes in one place.
For fintechs that already have some of this in place but are dealing with inconsistency — different numbers in different dashboards, or metrics that finance and ops argue about every month — the fix is usually not starting over. It is auditing what exists, identifying where definitions diverge, and introducing a semantic layer that acts as the single source of truth. We cover the mechanics of this in detail in our post on Authorization Rate Analytics, which applies the same principle to a specific and high-value payments metric.

The Metrics Your Payment Operations Dashboard Should Actually Show
Most payment ops dashboards show transaction volume and success rate. Those are table stakes — they tell you that your payment stack is working, but they do not tell you how well, how efficiently, or where it is about to break.
Here are the metrics that separate a functional payment ops dashboard from a genuinely useful one:
Settlement performance metrics
- Average settlement lag by PSP (days from transaction to funds received)
- Settlement lag vs. contracted SLA — percentage of transactions settling within agreed window
- Float balance by PSP at any point in time — critical for liquidity management
- Failed settlement batches by PSP, with reason code breakdown
Cost intelligence metrics
- Effective rate per transaction, broken down by card type, geography, and PSP
- Variance between contracted rate and applied rate — this surfaces billing errors
- Cost per payment method — card vs. A2A vs. wallet vs. bank transfer
- Monthly PSP cost trend, indexed to transaction volume to show true efficiency
Reconciliation health metrics
- Open exceptions by age — exceptions older than 24 hours need escalation logic
- Match rate: percentage of transactions that reconcile automatically vs. requiring manual review
- Daily reconciled volume as a percentage of total processed volume
- Exception resolution time — how long does it take your team to close an exception once flagged
Operational resilience metrics
- PSP uptime and availability, measured from your own transaction data (not the PSP's status page)
- Payment method availability by geography
- Retry success rate — what percentage of initially declined transactions succeed on retry, and what retry logic is most effective
If you are also building intelligence around your merchant or partner relationships, the post on Merchant Portfolio Analytics covers how to extend the same data foundation into risk and revenue segmentation at the portfolio level.
Frequently Asked Questions
Q: What is payment operations analytics?
A: Payment operations analytics is a data layer built across your payment infrastructure — covering PSPs, bank feeds, internal ledgers, and FX sources — that gives ops, finance, and product teams real-time visibility into settlement timing, PSP cost efficiency, reconciliation exceptions, and routing performance. It replaces manual spreadsheet-based reporting with automated, trusted metrics.
Q: Why do payment operations analytics projects fail?
A: Most fail for one of three reasons: data is ingested but never properly normalised, so dashboards show raw PSP data that nobody agrees on; metric definitions are not governed, so finance and ops calculate the same number differently; or the project is scoped as a reporting project rather than a data engineering project, meaning the underlying models are too fragile to maintain as the business scales.
Q: What data sources does a payment operations analytics stack need?
A: At minimum: PSP settlement and transaction feeds, internal transaction database, bank statement feeds, FX rate data, and your contracted fee schedule per PSP. As the stack matures, you add card network data, dispute and chargeback feeds, and routing decision logs so you can analyse routing efficiency end-to-end.
Q: How long does it take to build a payment operations analytics layer?
A: For a Series A or B fintech with two to four PSPs and a reasonably clean internal database, a functional first version — covering settlement visibility, PSP cost intelligence, and basic reconciliation exception reporting — typically takes eight to twelve weeks when delivered by a specialist team. The first dashboards are usually live within four to six weeks.
Q: What is the difference between payment operations analytics and payments reconciliation?
A: Reconciliation is one component of payment operations analytics — specifically the process of matching transactions across sources and identifying breaks. Payment operations analytics is broader: it also covers settlement timing, PSP cost efficiency, routing performance, operational resilience, and the dashboards that surface all of these to different teams in the business. Think of reconciliation as one domain within a larger payment ops data product.
Build the Visibility Your Payment Operations Team Actually Needs
Payment operations without analytics is management by exception — you find out what went wrong after it has already cost you time, money, or regulatory exposure. The businesses that get this right build their analytics layer early, govern it carefully, and treat it as infrastructure rather than reporting. At Fintel Analytics, we have helped fintech and payments businesses at every growth stage build exactly this kind of capability — from initial data audit and source integration through to production dbt models, semantic layers, and operational dashboards that their finance and ops teams use every day. If your team is still reconciling in spreadsheets, running reports manually, or arguing about which number is right, that is a solvable problem — and the economics of solving it make themselves back within months.