 Fintel Analytics
Authorization Rate Analytics: Fix Declining Payments in 2026
Poor authorization rates silently drain revenue from payment businesses. This guide shows exactly how to build the analytics stack to diagnose, monitor, and fix them.
Authorization rate analytics is the practice of measuring, diagnosing, and improving the share of payment transactions that successfully reach an approved state — broken down by PSP, card network, geography, decline code, and merchant category. For payment companies running at scale, a single percentage point improvement in authorization rates can translate directly into millions in recovered revenue. The problem is that most teams are flying blind: decline data sits in separate provider dashboards, nobody has built a unified model, and the ops team is making routing decisions from memory and gut feel.
This is not a niche technical problem. Each payment service provider has its own decline codes, reporting formats, and settlement timelines — data sits in separate provider dashboards, teams reconcile manually, and decline rates come back without enough context to act on. For most businesses, the starting point is the same: no unified view across these dimensions. Until you solve that data problem, you cannot solve the revenue problem underneath it.
This guide is written from delivery experience — from having built authorization rate analytics stacks for real payments companies, dug through raw decline code feeds, and rebuilt reporting that the ops team actually trusts.
Why Authorization Rate Data Is So Hard to Work With
The first thing that trips up every team new to this problem is the data structure. Authorization rate analytics sounds straightforward — approved transactions divided by attempted transactions — but the raw data is almost never structured to make that calculation clean.
Here is what you are actually dealing with in practice:
Multiple PSPs, multiple schemas. A Series A payments company might route transactions through Stripe, Adyen, and a local acquirer in each key market. Each provider exports transaction data in a completely different format. Stripe uses its own event model. Adyen uses a batch file format with different field names. The local acquirer sends an SFTP dump at 6 AM every morning. Before you can compute a single authorization rate, you need to normalise all three into a consistent schema — mapping decline codes, mapping transaction states, and resolving the fact that what Adyen calls a "refused" is what Stripe calls a "do_not_honor" and what your internal system calls a "soft decline."
Ambiguous transaction states. Not every transaction ends in a clean "approved" or "declined." You have pending authorisations, reversals, timeouts, retries, and duplicate attempts. If your pipeline counts retries as separate attempts, your decline rate is artificially inflated. If you deduplicate incorrectly, you hide real failures. Getting this right requires deliberately engineered dbt models, not ad-hoc SQL in a spreadsheet.
Latency in decline code data. Some providers surface decline reasons in the authorisation response. Others batch them into settlement reports that arrive T+1. If your ops team is monitoring real-time decline rates but the decline code breakdown only refreshes daily, they can see a problem but cannot diagnose it until the next morning — by which time the issue has often compounded.
A pattern we see repeatedly in our work with early-stage fintech companies: the payments team knows something is wrong — their overall approval rate is lower than expected — but they cannot tell you whether it is happening on Visa or Mastercard, whether it is concentrated in a specific geography, or whether it is a soft decline that should be retried or a hard decline that indicates fraud. That diagnostic gap is entirely a data infrastructure problem.

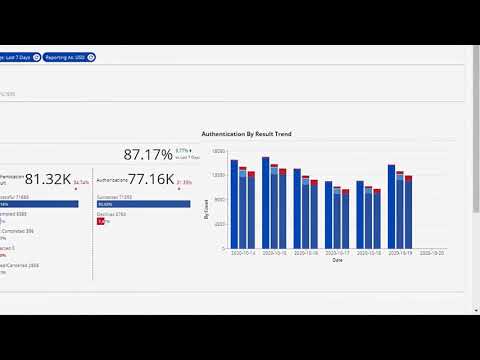
📺 Watch: Cybersource Analytics Authentication Dashboard
What a Mature Authorization Rate Analytics Stack Looks Like
Once you have the raw data normalised, the analytics layer needs to answer a specific set of questions that the payments and product teams will actually use. Here is how we structure this in practice.
Layer 1 — Raw ingestion and normalisation. Raw transaction feeds from each PSP land in BigQuery (or your warehouse of choice) via ELT pipelines. At this stage you are not transforming anything — you are preserving the raw data exactly as it arrives, with a source timestamp and a provider identifier. This is your audit layer. You never delete from it.
Layer 2 — Standardised transaction model (dbt staging layer). This is where the normalisation happens. A set of dbt staging models maps each provider's raw fields to a canonical schema: transaction_id, attempt_timestamp, provider, card_network, issuer_country, merchant_category_code, response_code, response_category (approved / soft_declined / hard_declined / timeout / duplicate), is_retried, retry_of_transaction_id. The response category mapping is the most critical and the most time-consuming — you need a lookup table that maps every provider-specific decline code to a standardised category, and this table needs to be maintained as providers update their code lists.
Layer 3 — Authorisation rate marts. With a clean staging model, you can build the metrics that matter. The core mart aggregates at the dimensions your team cares about: by provider, by card network, by issuer country, by MCC, by hour of day (to catch time-dependent routing issues), and by decline category. From this mart, you derive:
- Gross authorisation rate — total approved / total attempted, excluding duplicates and reversals
- Net authorisation rate — approved on first attempt only, no retries
- Soft decline recovery rate — of the transactions that received a soft decline, what percentage succeeded on retry?
- Hard decline rate by issuer country — often the most actionable signal for routing decisions
- Decline code concentration — what percentage of your total decline volume comes from the top five decline codes? In our experience, 60–70% of avoidable declines can typically be traced to three or fewer root causes.
Layer 4 — Operational dashboards and alerting. The marts feed dashboards built in Holistics BI or Looker, designed for two distinct audiences. The real-time ops view shows hourly authorisation rates by provider with threshold-based alerting — if Adyen's approval rate drops below a configurable floor, the on-call team gets a Slack notification before customers start complaining. The weekly product view shows trend lines by card network and issuer country, enabling the product team to build the data case for routing rule changes.
If you are looking to implement this kind of stack in your business, explore how Fintel Analytics approaches payment data engineering — we build exactly this kind of infrastructure for growth-stage payments and fintech companies globally.
The Decline Code Taxonomy Problem Nobody Talks About
Here is something the textbook gets wrong: it treats decline code analysis as a lookup exercise. You get the code, you look it up, you know what it means. In practice, decline code interpretation is a judgement call that requires domain knowledge, provider-specific context, and often empirical testing.
Take response code 05 — "Do Not Honour." It is the most common soft decline code across Visa and Mastercard, and it is also the least informative. It can mean the cardholder has insufficient funds. It can mean the issuer's fraud model flagged the transaction. It can mean there is a technical issue at the issuer. It can mean the card is blocked for online transactions. The same code, four completely different root causes, each requiring a different operational response.
What actually works is empirical classification: you look at the retry success rate for each decline code, segmented by card network and issuer country. A code with a 40% retry success rate within 24 hours is a soft decline worth retrying. A code with a 5% retry success rate is essentially a hard decline — retrying it wastes authorisation attempts, increases your fraud signals to the issuer, and degrades your overall approval rate over time.
We built exactly this kind of empirical classification for a Series A payments company processing cross-border transactions across six markets. Their previous approach was to retry all soft declines up to three times. Once we built the analytics layer that showed retry success rates by code and by issuer country, they discovered that two specific decline codes — which together accounted for nearly 30% of their retry volume — had a retry success rate below 8%. They were burning authorisation attempts and degrading issuer trust on transactions that were never going to convert. Removing those codes from their retry logic improved their net authorisation rate by 1.4 percentage points in the first month.
For a business processing tens of thousands of transactions per day, 1.4 percentage points is not a rounding error. It is material recovered revenue.
This connects directly to the broader challenge of PSP data analytics for fintech businesses — where the real value is not in the dashboards themselves but in the clean, trusted data models that power them.

How to Use Authorization Rate Analytics for Routing Decisions
Dynamic payment routing — the practice of sending transactions through different PSPs or acquirers based on real-time signals — is one of the highest-ROI optimisation levers available to a payment company. But routing decisions are only as good as the data that underpins them.
The standard naive approach is to route by headline authorisation rate: send more volume to whichever PSP has the highest overall approval rate. The problem is that headline rates mask enormous variation by card network, issuer country, and MCC. A PSP that performs well on UK Visa debit may be materially weaker on French Mastercard credit. If your routing logic does not account for this, you are leaving approval rate on the table.
Here is the decision framework we use with clients when building routing intelligence:
Step 1 — Segment your volume. Before you can route intelligently, you need to understand how your volume breaks down by the dimensions that predict authorisation outcomes: card network, issuer country, card type (debit / credit / prepaid), and MCC. Most companies are surprised by how concentrated their volume is — often 70–80% of transactions fall into a small number of segments.
Step 2 — Build provider performance matrices. For each meaningful volume segment, compute the net authorisation rate for each PSP over a rolling 30-day window. This is your routing intelligence layer. It should refresh daily at minimum, hourly if your volume supports stable estimates.
Step 3 — Establish routing rules with confidence thresholds. Do not route based on a single day's data. If a provider processes 50 transactions in a given segment in a day, that is not a statistically meaningful sample. Build confidence-weighted routing rules that only update when sample sizes are sufficient.
Step 4 — A/B test routing changes. Before committing volume to a new routing rule, run a controlled experiment: send a fixed percentage of eligible transactions through the new route and measure the lift against the control. This is standard practice in sophisticated payments operations, but it requires the analytics infrastructure to track experiment cohorts and measure outcomes cleanly.
Step 5 — Monitor for regime changes. PSP performance is not static. Acquirers change their underwriting, card networks update their fraud models, issuers adjust their authorisation policies. A routing rule that was optimal six months ago may be suboptimal today. Build automated alerts that flag when a provider's performance in a given segment deviates materially from its historical baseline.
More and more businesses are navigating payment complexity by shifting to a modular, composable approach — optimising payment infrastructure from one place. Payment optimisation strategies map to four outcomes that follow the transaction lifecycle: earn the transaction, get it approved, pay less for it, and recover it when it fails. Authorization rate analytics is what makes "get it approved" a data-driven discipline rather than guesswork.
What Good Looks Like: Outcomes From the Field
To make this concrete, here is what mature authorization rate analytics actually delivers for a payments business.
A reconciliation process that ran for 30–50 minutes per cycle was rebuilt as an automated SQL pipeline — it now completes in under 3 seconds. That is not just a speed improvement; it means the ops team gets accurate decline data in near real-time rather than waiting for a nightly batch.
Weekly executive reporting that required 90 minutes of manual work was replaced by a live dashboard. For a payments company, that weekly report typically included authorisation rates, decline code breakdowns, and provider performance — all of which are now updated hourly without anyone touching a spreadsheet.
An automated alerting system gave a treasury and payments team real-time visibility into provider risk for the first time. When a PSP's authorisation rate drops unexpectedly — a not-uncommon occurrence during high-traffic periods — the team now knows within minutes rather than discovering it the next morning in a settlement report.
The common thread across all of these outcomes is the same: the data was always there. The raw transaction feeds existed. The decline codes were being captured. What was missing was the engineering layer that turned raw PSP data into trusted, actionable metrics — and the operational tooling that put those metrics in front of the people who could act on them.
Without payment optimisation, failed transactions, unnecessary payment declines, and high processing costs silently erode margin. For subscription businesses, even a small improvement in authorization rates reduces involuntary churn and strengthens monthly recurring revenue without additional acquisition spend.
That is the business case for authorization rate analytics in a single sentence. The data infrastructure is the investment. The recovered approval rate is the return.
Frequently Asked Questions
Q: What is a good authorization rate for a payments business?
A: Benchmarks vary significantly by business model, geography, and card mix, but a general rule of thumb is that well-optimised e-commerce businesses should target net authorisation rates of 85–92% or higher on domestic transactions, with cross-border rates typically 5–10 percentage points lower. If your overall rate is below 80%, that is a clear signal that either your routing logic or your retry strategy — or both — needs work. The more important question is not your absolute rate but your rate relative to what is achievable for your specific transaction mix.
Q: How do I diagnose why my payment authorization rate is dropping?
A: Start by segmenting the decline rate across four dimensions simultaneously: PSP, card network, issuer country, and decline code category. A drop that is isolated to one PSP and one card network is almost certainly a provider-side issue. A drop concentrated in a specific issuer country may signal a fraud model update at a major issuer. A rise in a specific decline code — particularly do_not_honor or insufficient_funds — tells you something different again. Without that segmentation, you are looking at an average that hides the root cause.
Q: What data do I need to build authorization rate analytics?
A: At minimum, you need transaction-level data from each PSP that includes: a unique transaction identifier, an attempt timestamp, the card network, the issuer country (BIN-derived or PSP-provided), the response code, and a flag indicating whether the transaction is a retry of a previous attempt. Most major PSPs — Adyen, Stripe, Checkout.com, Worldpay — provide this data via API or batch export. The engineering challenge is normalising it into a consistent schema across providers and building the dbt models that compute meaningful metrics from it.
Q: Should I use a third-party payment optimisation tool or build my own analytics?
A: Third-party tools can accelerate time-to-insight, but they come with significant trade-offs: limited ability to customise metrics to your specific business model, data that lives outside your warehouse (creating a single source of truth problem), and ongoing subscription costs that scale with volume. For early-stage companies processing under $10M per month, a vendor tool may be pragmatic. Above that threshold — and especially if you have multiple PSPs, multiple markets, or a complex retry logic — building your own analytics layer in dbt on top of your data warehouse gives you far more control, customisability, and trust in the numbers.
Q: How often should authorization rate data refresh?
A: It depends on your volume and operational needs. For real-time alerting on approval rate drops, you need pipeline latency measured in minutes — this typically requires webhook-based ingestion or near-real-time API polling. For routing optimisation decisions, daily refreshes of rolling 30-day performance matrices are usually sufficient. For weekly executive reporting, a T+1 batch pipeline is often adequate. The mistake is treating all of these needs the same — over-investing in real-time pipelines for metrics that only inform weekly decisions, or under-investing in alerting that needs to fire within minutes of an incident.
For payments and fintech businesses operating in competitive markets, authorization rate analytics is not a nice-to-have — it is the infrastructure that converts raw transaction data into a measurable competitive advantage. The difference between a team that knows their approval rate dropped and a team that knows exactly which PSP, which card network, and which decline code caused it — and can reroute volume within the hour — is entirely a data engineering problem. At Fintel Analytics, we have built this kind of stack for payments companies from Series A through Series B, across e-commerce, cross-border payments, and embedded finance — from initial data audit through to production dashboards and automated alerting. If your payments team is still diagnosing declines from provider dashboards and spreadsheet exports, that is a fixable problem, and fixing it pays for itself in recovered authorisation rate within weeks.