
Revenue leakage analytics is the practice of using data pipelines, SQL models, and BI tooling to continuously monitor the gap between what a business is contractually owed and what it actually collects. For SaaS and fintech companies, this gap is rarely zero — and the longer it goes undetected, the more it compounds.
According to MGI Research (2024), SaaS companies lose 3–5% of ARR to revenue leakage on average. At $10M ARR that is $300–$500K walking out the door every year — not because customers churned, but because the data infrastructure connecting contracts, billing, usage, and payments was never designed to catch discrepancies. 73% of SaaS finance teams admit they cannot quantify their revenue leakage (BVP Subscription Economy Index, 2024). That is not a billing problem. That is a data problem.
This post is written for founders, CFOs, and heads of engineering at growth-stage SaaS and fintech companies who suspect revenue is leaking but do not yet have the analytics infrastructure to find it, measure it, or fix it systematically.
Why Revenue Leakage Is a Data Architecture Problem First
The conventional framing of revenue leakage — missed invoices, failed payments, expired cards — makes it sound like an accounts receivable issue. In practice, the root cause is almost always upstream: disconnected systems with no unified data layer sitting between them.
Here is what that looks like in production. Your CRM closes a deal with a negotiated pricing tier. That deal is manually keyed into a billing platform. The billing platform does not sync with your product usage database. A customer upgrades mid-cycle but the proration logic in the billing system has an off-by-one bug on the tier boundary. Finance reports what was invoiced. Nobody is comparing it against what should have been invoiced based on the contract and usage data. The leak runs for six months before an auditor or a due diligence process catches it.
If contract terms live in Salesforce, DocuSign, Stripe, NetSuite, a spreadsheet, and someone's Slack thread, every handoff becomes a leak point. The problem compounds because SaaS billing repeats. A configuration error in January does not only affect January — it can repeat every month until someone notices.
A pattern we see repeatedly when working with early-stage SaaS and fintech companies: the billing system is treated as the source of truth for revenue. It should not be. The contract is the source of truth. The billing system is a downstream execution layer — and it needs to be continuously validated against the contracts and usage data it is supposed to reflect.
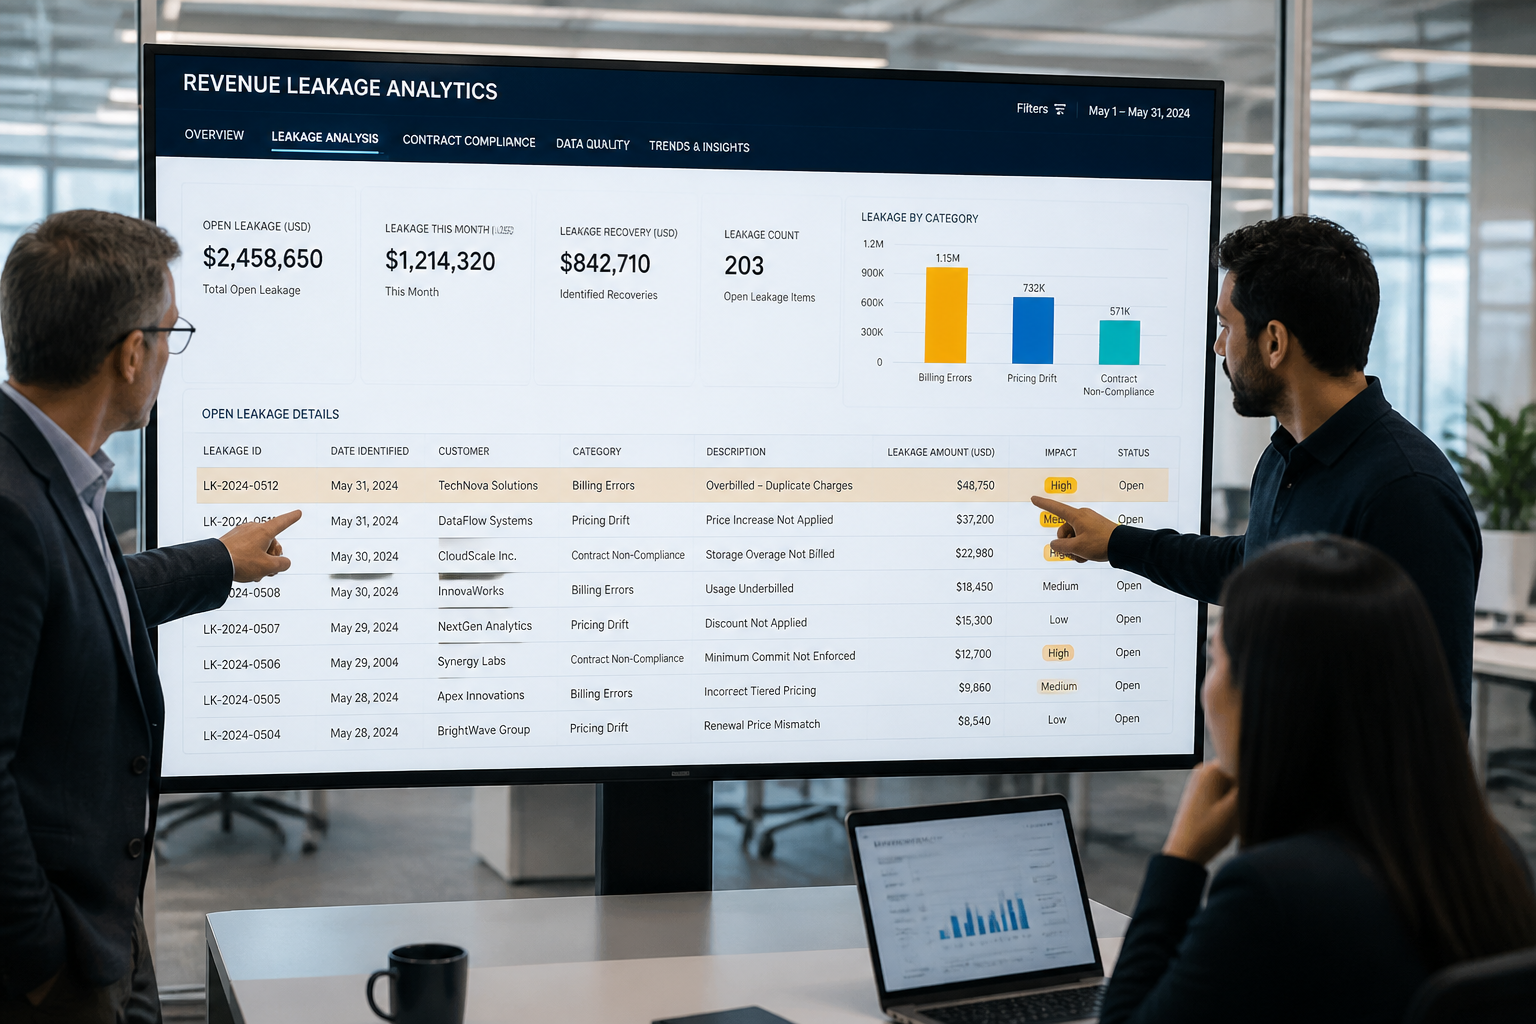
Leakage breaks down by cause as follows: 38% billing errors, 31% pricing drift, 22% contract non-compliance, 9% failed payment gaps (LeakShield benchmark, 2026). Each of these categories maps to a specific data join that your analytics layer either has or does not have.
📺 Watch: How AI-Powered Automation Prevents Revenue Leakage in the Order-to-Cash Process | HighRadius

What the Numbers Look Like at Scale — and at Fundraising Time
The valuation dimension of revenue leakage is the figure that tends to focus leadership attention. At a median 7x SaaS revenue multiple (Bessemer Cloud Index, Q4 2025), every $1 of annual leakage destroys $7 in enterprise value. A $10M ARR company leaking 4% ($400K) is losing $2.8M in potential valuation.
That number matters most when an investor's due diligence team starts pulling contract-to-cash reconciliations. If your finance team cannot produce a clean audit trail from signed contract to collected payment, with usage data as the bridge, expect that gap to surface as a valuation adjustment — or a deal condition.
Leakage rates are not uniform across billing models. Subscription businesses lose 3–9% of revenue to leakage depending on billing model: 2–4% for flat-rate SaaS, 3–6% for tiered SaaS, 4–9% for usage-based, 5–9% for hybrid, and 5–11% for professional services (MGI Research 2024; Vayu 2025; Clari 2024; SPI Research 2024). If your company has moved to usage-based pricing — which most growth-stage SaaS companies have, or are considering — your leakage risk has materially increased, because the gap between metered usage and billed amounts is harder to validate manually.
In our work with a Series A fintech operating a usage-based API billing model, we found that a reconciliation process that previously took 30–50 minutes to run manually was rebuilt as an automated SQL pipeline that completed in under 3 seconds. The speed improvement mattered less than the fact that it was now running daily rather than monthly — which meant discrepancies were being caught in days rather than compounding for a full billing cycle.
The Four Data Joins Your Revenue Leakage Stack Must Have
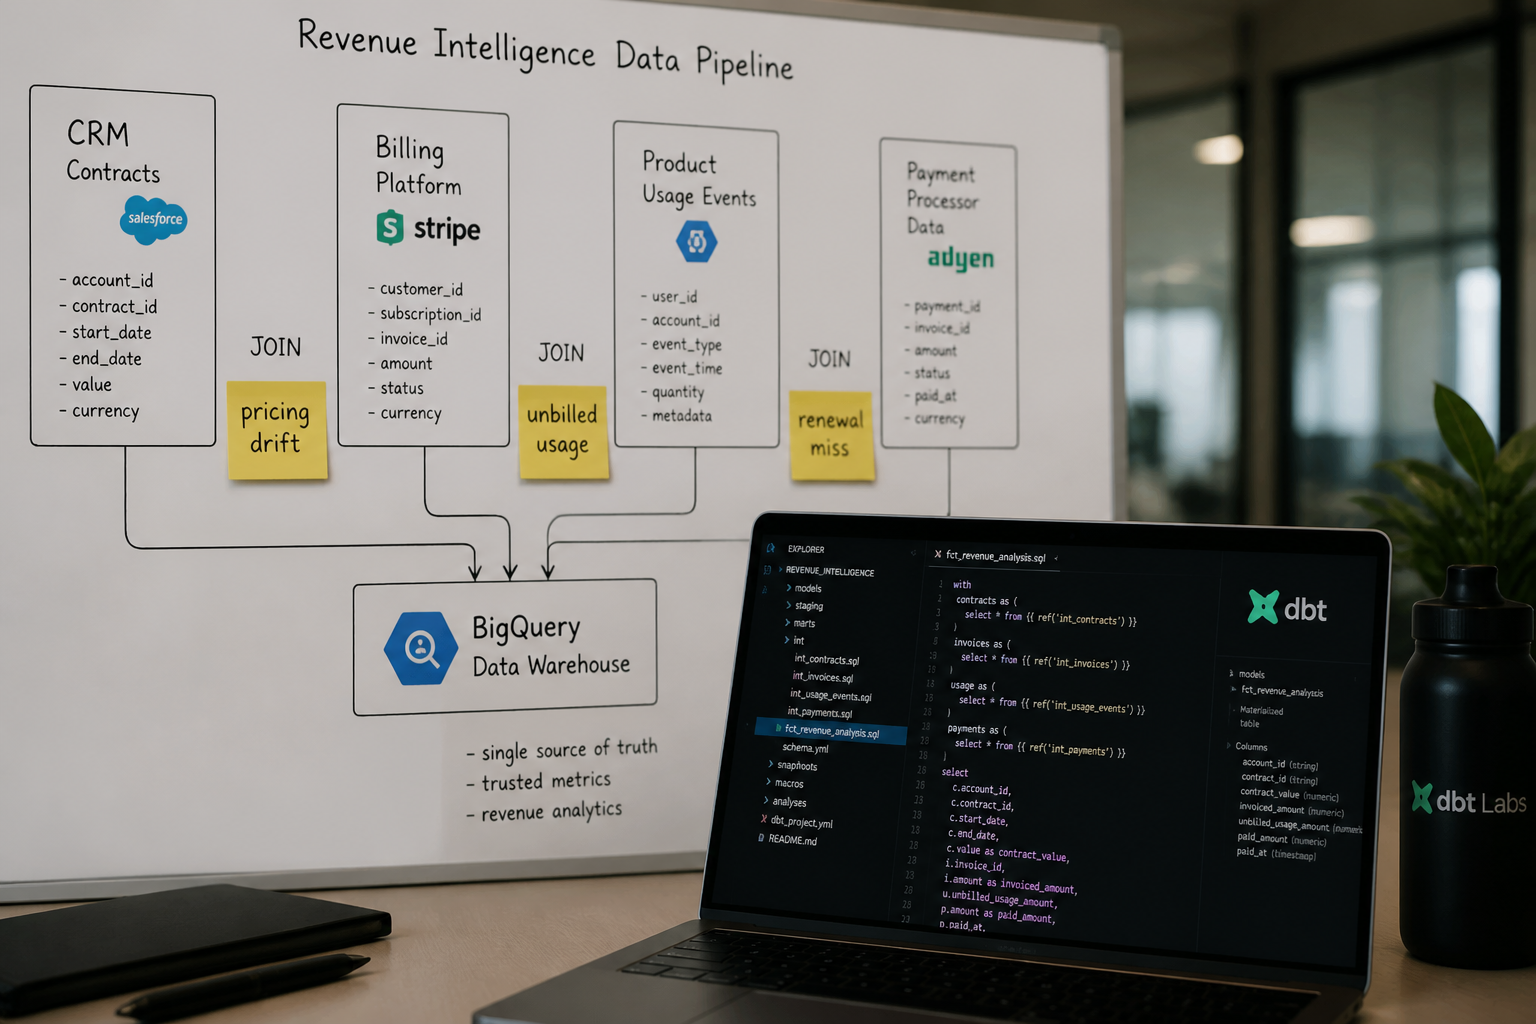
Building revenue leakage analytics is not primarily a tooling problem. It is a modelling problem. You need SQL models — ideally built in dbt — that reliably join four data domains:
1. Contract data → Billing configuration Every signed contract should produce a billing rule. The first join validates that the billing system's configuration matches the contracted rate, tier, discount, and term. A 2024 Cledara analysis found that 42% of SaaS companies have at least one active subscription where the billed rate does not match the current list price or contracted rate. This is the most common and most fixable category of leakage — and it requires nothing more than a reliable join between your CRM or contract management system and your billing platform.
2. Usage data → Billed amounts For usage-based or tiered models, every billable event in your product database needs to be aggregated and compared against the corresponding invoice line item. The most insidious form of pricing enforcement failure is in graduated and volume pricing tiers. When a customer's usage crosses a tier boundary, the billing system must apply the correct rate to the correct volume segment. A graduated pricing model requires the system to split usage precisely at the boundary. Rounding errors, off-by-one bugs, and timezone-related boundary misalignment all create consistent underbilling that is nearly invisible in aggregate reporting. This join requires your product event data to land in your warehouse in a normalised, queryable form.
3. Invoices → Payments collected The accounts receivable join: every invoice that was issued should map to a collected payment, a documented write-off, or an active outstanding balance. A sudden increase in overdue invoices or a growing percentage of older receivables could indicate problems in your billing or collection processes, contributing to revenue leakage.
4. Expected renewals → Actual renewals For subscription businesses, every customer approaching their renewal date should appear in a renewal pipeline model. If a customer's contract end date passes without a renewal event being recorded, that is a candidate leak. According to Chargebee's 2025 State of Subscriptions Report, companies using automated credit management systems reduced credit-related revenue leakage by 34% compared to manual processes.
None of these joins are technically complex. What makes them hard in practice is data quality: inconsistent customer IDs across systems, CRM data that never flows to the warehouse, usage events that land in S3 but never get modelled, billing exports that are pulled manually each month and loaded as flat files. The data engineering work — building reliable, tested pipelines that land clean data from each of these systems into a central warehouse — is what unlocks the analytics.
If you are looking to implement this kind of revenue intelligence infrastructure, explore how Fintel Analytics approaches this — we design and deliver exactly this kind of contract-to-cash data stack for growth-stage SaaS and fintech companies globally.
How to Build a Revenue Leakage Detection Model in dbt
The cleanest implementation we have delivered for clients uses dbt to build a layered set of models on top of a BigQuery warehouse. Here is the pattern:
Staging layer: One model per source system — one for CRM deals/contracts, one for billing platform subscription records, one for product usage events, one for payment processor data. At this layer, the only job is normalisation: consistent customer IDs, consistent timestamp formats, consistent currency handling.
Intermediate layer: Joins across systems. A contract_billing_reconciliation model joins CRM contract terms to billing configurations and flags mismatches. A usage_invoice_reconciliation model aggregates usage events by customer and billing period, then joins to invoice line items and flags deltas above a configurable threshold.
Mart layer: A revenue_leakage_summary model that surfaces every flagged discrepancy with a category tag (pricing drift, unbilled usage, payment gap, renewal miss), an estimated dollar value, and an account owner. This model feeds directly into a BI dashboard — in our stack, typically Holistics or Looker — where the finance team has a live view of open leakage by category and severity.
dbt tests: Every reconciliation model should carry schema tests for referential integrity (every billing record should have a matching contract), and custom data tests that fail the pipeline if the aggregate leakage amount exceeds a threshold. See our post on dbt testing strategy for startups for the testing patterns that belong on every model in this stack.
The critical addition — and the one most teams skip — is the alerting layer. A dbt model that surfaces leakage only gets actioned if someone is looking at the dashboard. Automated alerts (Slack or email notifications triggered when a new leakage record exceeds a dollar threshold) are what turn a passive reporting model into an operational control.
In our work with a global fintech, an automated alerting system gave the finance team real-time visibility into billing discrepancies for the first time — reducing the time between a leakage event occurring and a corrective action being taken from weeks to hours.
The Metrics Your Leakage Dashboard Should Track
Once the data models are in place, the BI layer should present a small set of operationally useful metrics — not a sprawling list of KPIs that nobody checks:
- Leakage rate (%): Total flagged leakage for the period ÷ contractually due revenue for the same period. Track weekly. Trend matters more than the absolute figure.
- Leakage by category: Billing errors, pricing drift, contract non-compliance, failed payments — broken down as percentages and dollar values so the finance and engineering teams know where to direct effort.
- Open leakage backlog: Dollar value of flagged discrepancies not yet resolved, aged by time-in-queue. This is the number that matters to a CFO.
- Recovery rate: Of flagged leakage items actioned in the prior period, what percentage was recovered? This closes the feedback loop and validates that the model is working.
- Accounts at risk: A list of specific customer accounts with active leakage flags, sorted by estimated dollar exposure. This is the operational output the finance team actually uses.
AI revenue leakage detection represents a shift away from reactive, manual reviews toward proactive, continuous monitoring. Instead of waiting for month-end reconciliations or quarterly audits, systems evaluate revenue activity as it happens, enabling real-time monitoring across the entire billing lifecycle. That shift — from monthly reconciliation to continuous pipeline — is the architectural ambition. But you do not need ML to get there. A well-modelled dbt stack with reliable data sources and automated alerting delivers most of the value.
For companies that have moved to complex usage-based or hybrid billing models, an ML anomaly detection layer on top of the reconciliation models adds genuine value: it can flag unusual patterns in usage data that suggest a metering failure before the billing cycle closes, rather than after. In fintech and payments organisations, machine-learning frameworks designed for payment systems can detect abnormal patterns such as spikes in soft declines, routing failures, or gateway misconfigurations in near real time. This early visibility allows teams to correct processing issues before they trigger cascades of failed payments or renewals that would otherwise be discovered only after revenue impact becomes visible.
For a deeper look at how payment-layer data feeds into this kind of operational analytics, see our post on PSP data analytics — the payment processor data that lands in your warehouse is a critical input to any revenue leakage detection model.
Frequently Asked Questions
Q: What is revenue leakage analytics?
A: Revenue leakage analytics is the use of data pipelines, SQL models, and BI dashboards to continuously compare what a business is contractually owed against what it actually invoices and collects. It turns the contract-to-cash process into a monitored, auditable data flow rather than a periodic manual reconciliation.
Q: How much revenue do SaaS companies lose to leakage?
A: According to MGI Research (2024), SaaS companies lose 3–5% of ARR to revenue leakage on average. Leakage rates are higher for more complex billing models: usage-based SaaS typically loses 4–9%, and hybrid models 5–9%. At a $10M ARR company, this translates to $300–$500K per year of contractually earned revenue that is never collected.
Q: What causes revenue leakage in SaaS billing?
A: The four main causes by frequency are: billing configuration errors that do not match contracted rates (38%), pricing drift where discounts or promotional rates are never reversed (31%), contract non-compliance where agreed terms never make it into the billing system (22%), and failed payment gaps (9%) — per LeakShield benchmark data, 2026. All four are detectable through data joins across CRM, billing, usage, and payment systems.
Q: How do you detect revenue leakage with data analytics?
A: The most robust approach is to build SQL reconciliation models — ideally in dbt — that join contract data to billing configuration, usage events to invoiced amounts, invoices to collected payments, and expected renewals to actual renewals. Discrepancies in each join surface as flagged leakage records. Alerting on those flags turns a passive dashboard into an operational control.
Q: Does fixing revenue leakage require machine learning?
A: No. The majority of detectable revenue leakage can be found using deterministic SQL joins between your CRM, billing platform, usage database, and payment processor data. Machine learning adds value in complex usage-based billing environments where anomaly detection can flag metering failures before a billing cycle closes — but that is a second-phase capability, not a prerequisite.
The leakage in your billing stack is almost certainly there — most growth-stage SaaS and fintech companies have it, and most do not have the data infrastructure to find it until an audit or fundraising process forces the issue. At Fintel Analytics, we have helped Series A and Series B companies build the exact contract-to-cash data stacks described in this post — from staging models that normalise messy source data, through reconciliation models that flag discrepancies in real time, to BI dashboards that give finance teams an operational view of open leakage every morning. If your billing data still lives across disconnected systems and your revenue assurance process is still a monthly spreadsheet exercise, that is a fixable problem — and the fix routinely pays for itself within the first billing cycle.