 Fintel Analytics
Net Profit Per Order: Fix E-Commerce Margin Blind Spots
Most e-commerce teams know revenue per order but not what the order made after costs. Here is how to build net profit per order in SQL and keep it trustworthy.
Net profit per order is the revenue from a single order minus every cost that order triggered: product cost, payment fees, outbound shipping, packaging, discounts, an allowance for returns, and the ad spend that won the customer. The reliable way to get it is to model it at order level in SQL, joined from your storefront, supplier costs and bank data. A monthly spreadsheet blends away the products, channels and discount codes that lose money on every sale.
If you run an e-commerce brand, you probably know your revenue per order to the cent. Ask what that order made after costs and the answer is usually a pause, then a gross margin figure that ignores half the bill. A pattern we see repeatedly in early-stage companies is operations spread across a storefront, a spreadsheet, a supplier inbox and a bank app, with nobody able to say what one order actually earned. This post explains what belongs in the calculation, how to build it, and when to build it yourself instead of buying an app.
Why Does Revenue Reporting Hide Your Real Net Profit Per Order?
Revenue reporting hides it because every cost that matters lives in a different system from the sale. The storefront knows the price and the discount code. The supplier invoice sits in an inbox. Shipping charges arrive as a carrier invoice weeks later. Payment fees land inside a bank payout. Refunds show up as a separate event. No single tool joins them, so the number nobody can see is the one you most need.
The gap is bigger than most founders expect. One 2026 analysis of e-commerce margin leakage describes a brand with 55% gross margin whose contribution margin falls to 26.2% once returns, fulfilment, marketplace fees and payment processing are deducted, less than half the headline figure. The assumptions are the author's, but the pattern matches what we see in client data. The same analysis argues that margin leakage happens at the order level, which is why aggregate views do not catch it until month-end close.
There is also little cushion to absorb mistakes. NYU Stern's industry dataset, updated in January 2026, reports a 5.61% net margin for general retail and 5.19% for specialty retail. At those levels, a mis-modelled shipping cost or an untracked return rate is the difference between a healthy business and one that is quietly buying revenue.
The practical consequence is that decisions get made on the wrong number. You scale the ad campaign with the best ROAS, but it sends traffic to the product with the highest return rate. You offer free shipping on a low-priced item that never covered it. You reorder from the supplier whose unit cost drifted up two quarters ago. None of this appears in a revenue dashboard.
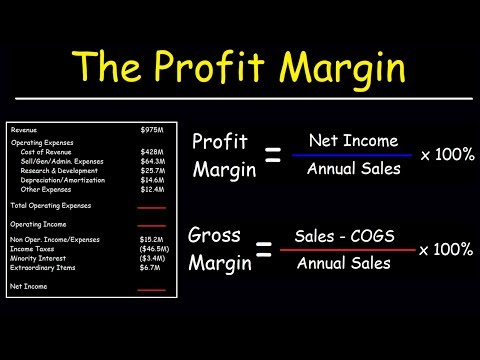
📺 Watch: Profit Margin, Gross Margin, and Operating Margin - With Income Statements
What Costs Belong in a Net Profit Per Order Calculation?
Every variable cost the order caused belongs in it, in the order below, so you can see margin at each layer:
- Revenue net of discounts, and net of tax collected on behalf of the tax authority
- Cost of goods sold: unit cost, inbound freight and duties, using the cost that was true when you bought the stock
- Payment processing: percentage plus fixed fee, and cross-border or currency surcharges
- Outbound shipping and packaging, plus pick-and-pack if you use a fulfilment partner
- Returns provision: expected cost of returns, trued up when actual refunds land
- Acquisition cost: ad spend allocated to the order or its channel
Two of these are routinely wrong.
Returns. The National Retail Federation and Happy Returns estimated that 19.3% of online sales would be returned in 2025. Return handling is also not cheap: estimates put the processing cost at between $10 and $65 per item, with an average around $20 to $30. These are industry-wide figures, so your category will differ, and apparel will look very different from beauty. The point is that returns are a margin event on one order in five, and a model that ignores them overstates profit on every product.
Payment fees and cost drift. Blended fee rates mislead. Some storefront plans, for example, add roughly 1% on cards issued outside your country, so a store with a quarter of its traffic overseas pays a different effective rate than its headline. Supplier costs drift too: on a $30 product costing $8.50, a $1.25 cost increase drops gross margin from 40% to 35.8%, and nobody notices because the change arrived on an invoice, not an alert.
Here is an illustrative order with assumed figures, not client data. An $80 order carries $28 of product cost, which is a 65% gross margin. Payment fees at 2.9% plus $0.30 take $2.62. Outbound shipping is $6.50 and packaging and pick-and-pack $2.00. A returns provision of 19.3% of an assumed $25 return cost adds about $4.83. Ad spend allocated to the order is $18. What is left is $18.05, a 22.6% contribution margin. The order that looked like a 65% margin sale earned roughly a third of that. Remove the ad spend and a different story appears, which is why the model should show margin at every layer, not just one final number.

Why Can't a Spreadsheet Hold Order-Level Profit?
It can for a while, which is exactly the trap. At 50 orders a week, a sheet with a cost column and a shipping column works. At 500, it becomes the thing the business depends on and nobody wants to touch. We see the same failures every time:
- Someone overwrites a formula, or pastes a cost in the wrong format, and the margin figure silently changes
- Unit costs live in a single cell per product, so when the supplier price changes, historical margins change with it and last quarter's profit is rewritten
- Refunds and partial shipments are entered by hand, or not at all
- Two people keep two copies, and the numbers disagree in the Monday meeting
These are the first two recurring patterns we work on with early-stage companies: critical operations running in sheets that belong in SQL models, and inputs with no validation or safeguards. In one engagement, moving calculations out of spreadsheets and into dbt models removed a class of recurring manual errors and cut weekly maintenance time by 30 minutes. In another, weekly executive reporting that took 90 minutes of manual work became a live dashboard, updated hourly, with no manual effort. The time saved matters less than the fact that the number stopped depending on one person's afternoon.
If you are weighing how to implement this in your organisation, explore how Fintel Analytics approaches this. We work with growth-stage businesses globally to design and deliver exactly this kind of order-level profit model, from the SQL layer to the dashboard your operations team uses daily.
The spreadsheet does not need to disappear. Teams still keep expense logs and supplier notes in sheets, and that is fine. The fix is to treat the sheet as an input that is read, validated and synchronised into the warehouse, not as the place where margin is calculated. If you want the practical migration path, our guide to moving finance logic from spreadsheets into SQL covers it step by step.
How Do You Build Net Profit Per Order in SQL?
The build is more about modelling decisions than technology. These are the steps we follow, and the places where a first attempt usually goes wrong.
1. Fix the grain at the order line. Model one row per order line, then roll up to the order. Margin per product and per order both fall out of that, and multi-item orders stop distorting your averages.
2. Store cost of goods as a dated table. Each product gets rows with a cost, an effective-from date and an effective-to date. An order joins to the cost that was true when it was placed. This one change stops last quarter's profit being rewritten every time a supplier raises a price.
3. Allocate shared costs explicitly. A shipping charge on a three-item order has to be split by weight, value or unit count. Pick a rule, document it and apply it everywhere. The rule matters less than applying it consistently.
4. Book a returns provision, then true it up. Charge each order an expected return cost based on its product category's historical rate, then replace the estimate with the actual refund and return shipping once they arrive. This gives you a usable number on day one and an accurate one by month-end.
5. Treat ad spend honestly. Order-level attribution is rarely precise enough to trust. Allocate spend by channel and day, show contribution margin both before and after acquisition cost, and do not pretend the last digit is exact.
6. Get dates and currencies right. An order placed late at night in one timezone lands on a different day in another, and a multi-currency order needs a rate fixed on a defined date. These look like edge cases until they cause a month-end discrepancy. Our guide to timezone errors in financial reporting shows how day boundaries break totals.
7. Reconcile against something you trust. Total net revenue from the model should tie to bank payouts, adjusted for fees and refunds. Build that as an automated test. We have rebuilt a hand-maintained spreadsheet as a database-backed tracker and reconciled it to the cent against the original before retiring the sheet. The same discipline applies here: do not switch off the old number until the new one matches it, or you can explain every difference.
A real example of why step seven matters: a capital reconciliation project we ran for a fintech uncovered a $25M discrepancy that had gone undetected, which at market borrowing rates was costing over $6,000 per day. E-commerce margins are smaller numbers, but the mechanism is identical. A gap that no one is looking for does not announce itself.
Should You Buy a Profit App, Model It in Your Warehouse, or Build an Operations Hub?
There are three realistic routes, and the right one depends on how complicated your cost structure is, not on how big you are.
Buy an off-the-shelf profit app if you have one storefront, simple product costs, one currency and a standard shipping setup. You get a working view quickly. The limits show up when you need a custom allocation rule, a supplier prepayment balance, or a number that reconciles to your own bank data.
Model it in your warehouse with dbt and a BI layer if you have several data sources, your own cost logic, or investors who will ask how the margin figure is calculated. You own the definitions, the history and the tests. This is the route that survives due diligence, and it is where we typically start for companies with a data team of zero to two people.
Build an operations hub if the real problem is not just the number but the daily work around it: reconciling supplier payments, logging expenses, answering routine questions, producing content. For one e-commerce brand we built a hub that shows net profit and margin per order after cost of goods, tracks the balance on supplier prepayments, and keeps an expense log in sync with the team's existing spreadsheet. The same hub runs AI pipelines that draft blog and social posts for a human to approve before anything is published.
A few questions help you decide:
- Can you explain, in one sentence, how every cost reaches the order? If not, model it in the warehouse first.
- Do you carry cash tied up in supplier prepayments? If so, profit and cash diverge and you need both views.
- Is someone spending hours each week copying data between a storefront, a sheet and a bank app? That is the hub's job.

How Do You Keep the Number Trustworthy and Keep AI Costs Under Control?
A profit model that people stop trusting is worse than none, because it gets quietly ignored. Three habits keep it alive.
Validate inputs at the door. Add tests for missing costs, negative margins, orders with no shipping cost and products with no cost record. A product that sells with a missing cost shows 100% margin, which is the most flattering and most wrong number in the dataset.
Define it once. Put the calculation in a SQL semantic layer so finance, operations and marketing all read the same definition. The pattern we see most often is the same metric showing different numbers on different dashboards, with leadership unsure who to believe. One governed definition ends that argument. If you already have dashboards nobody trusts, our dashboard sprawl audit is a useful first step.
Keep humans in the loop for anything that publishes or spends. Where AI sits on top of the profit data, for example drafting marketing copy or answering margin questions, keep an approval step before output goes out. Route routine questions to a cheap model and reserve a stronger one for the analysis that needs it, so running costs stay small. Show what each run costs. Many AI pilots stall because nobody can say what they cost per run, what happens when they are wrong, or who approves the output. We cover how to answer the first of those in our guide to AI agent cost per run.
Frequently Asked Questions
Q: How do you calculate net profit per order?
A: Start with order revenue after discounts, then subtract cost of goods, payment fees, outbound shipping, packaging, a returns provision and allocated ad spend. Do it at order-line level in SQL so multi-item orders and shared costs are handled consistently. Show margin at each layer so you can see where the money goes.
Q: What is a good net profit margin per order for e-commerce?
A: It varies by category, but net margins across general retail are thin. NYU Stern's January 2026 industry dataset reports about 5.6% for general retail. Track contribution margin per order as well, since it shows margin before overheads and tells you whether each sale is worth making.
Q: Why is my profit per order lower than my gross margin suggests?
A: Gross margin usually counts only product cost. Shipping, payment fees, returns and ad spend all sit below it. Because roughly one in five online sales was returned in 2025 according to NRF and Happy Returns, returns alone can remove a large share of margin on affected products.
Q: Can I track profit per order in a spreadsheet?
A: Yes at low volume, but it gets fragile quickly. Overwritten formulas, a single cost cell per product and manual refund entry rewrite history and break trust. Moving the logic into SQL models, with the spreadsheet kept only as a validated input, removes most of those failures.
Q: When should an e-commerce business build its own profit model instead of buying an app?
A: Build your own when you have multiple data sources, custom cost rules, supplier prepayments or multiple currencies, or when investors will want to see how the number is derived. An app is fine for a single storefront with simple costs. The deciding factor is cost complexity, not company size.
From Gut Feel to a Number You Can Defend
The challenge is simple to state and hard to solve alone: your storefront, spreadsheet, supplier inbox and bank app all hold part of the answer, and nobody can say what one order made after costs. At Fintel Analytics, we have built order-level profit models and operations hubs for e-commerce teams, from the SQL definitions and validation tests through to dashboards and approval workflows that run in production with cost tracking and audit trails. Every week you keep scaling on a blended margin is a week you may be funding the wrong products, and the fix is faster and cheaper than most founders expect.