 Fintel Analytics
Manual Data Entry Validation: Stop Bad Numbers Early (2026)
Hand-keyed figures in sheets quietly corrupt dashboards. Here is the three-layer validation pattern we use to catch bad inputs before leadership sees them.
Manual data entry validation means checking every hand-keyed figure (amounts, dates, currencies, categories) against explicit rules before it reaches your warehouse, and quarantining anything that fails instead of letting it flow into dashboards. The pattern that works in practice has three layers: constraints where people type, automated checks when the data is ingested, and business-rule tests in your transformation layer. Skip any one of them and a wrong number will eventually reach a board pack.
Most growth-stage companies have at least one process that depends on someone typing numbers into a sheet: an expense log, a supplier price list, a partner revenue share table, a manual FX rate, a treasury position that a person updates each morning. Nobody planned for this to become critical infrastructure. It just did, because the sheet was fast and the engineering backlog was long. Then the sheet got wired into a dashboard, the dashboard got wired into a weekly leadership review, and now a stray decimal point can change a decision.
This post covers what to validate, where to put each check, how to build the layer between a spreadsheet and your warehouse, and how to decide when the sheet should stop being the input mechanism altogether.
Why Does Manual Data Entry Keep Producing Bad Numbers?
Because spreadsheets give people total freedom and zero guardrails, and the errors they produce look exactly like correct data. A cell containing 1,200 or 12,00 or 1200 USD or 'approx 1.2k' all sit quietly in the same column until something downstream tries to add them up.
The research backs up what we see in the field. A 2024 study found that 94% of spreadsheets used in business decision-making contain errors. That figure comes from a literature review, so treat it as a signal about how common the problem is rather than a precise rate for your own files. More recent operational data points the same way: a 2026 DOSS Research survey of over 1,000 U.S. operations professionals found teams lose about 22 full workdays per employee each year to fixing spreadsheet errors. The same survey found that manual data entry mistakes were the most common error type at 59%, ahead of formula errors (46%) and copy-paste issues (45%).
The detail that matters most for founders: only 41% of organisations in that survey had a formal quality control process for high-stakes spreadsheet decisions. And this is not a fringe habit. The 2025 AFP FP&A Benchmarking Survey reports that 96% of FP&A professionals still use spreadsheets for planning and 93% for reporting. You are not going to eliminate spreadsheets. You need to put a control layer around them.
A pattern we see repeatedly in early-stage companies is that the data input has no validation at all: wrong formats, manually keyed figures, formula errors. The result is metrics nobody trusts. The business does not usually notice the error. It notices that finance and operations disagree, spends a week arguing about whose number is right, and then quietly stops trusting both.
📺 Watch: How to Create a Drop-Down List in Excel | Data Validation

What Should Manual Data Entry Validation Actually Check?
Six categories of rule cover the large majority of failures we have seen. Most teams only implement the first one, if any.
1. Type and format
Is the amount a number? Is the date a real date in the expected format? Is the currency a valid ISO code? This sounds trivial, but a single column that mixes text and numbers can silently turn a SUM into a partial sum, or cause a whole pipeline run to fail at 6am.
2. Allowed values
Categories, cost centres, supplier names, provider names, and country codes should come from a controlled list. If your expense log has 'Marketing', 'marketing', 'Mktg' and 'Marketting', your spend-by-category chart is wrong before anyone looks at it.
3. Range and sign
Is the value plausible? A refund keyed as a positive number, a percentage entered as 15 instead of 0.15, or an amount ten times larger than the historical maximum for that category are all common. Range rules do not need to be clever. A simple 'flag anything above X times the trailing median' catches most keying slips.
4. Completeness and uniqueness
Required fields that are blank, and rows pasted in twice. Duplicate rows are one of the most expensive silent errors because they inflate totals while looking perfectly valid.
5. Cross-field consistency
Does the end date come after the start date? Does the currency match the account it is booked to? Does the line total equal quantity multiplied by unit price? These checks catch errors that no single-column rule can see.
6. Reconciliation to an independent source
The strongest control is comparing the hand-keyed total against something the person did not type: a bank feed, a provider statement, a ledger balance. In one capital reconciliation project, this kind of comparison uncovered a $25M discrepancy that had gone undetected, and at market borrowing rates that gap was costing over $6,000 per day. Nobody had made a typo in the obvious sense. The inputs had simply never been compared to anything independent.
How Do You Build a Validation Layer Between a Spreadsheet and BigQuery?
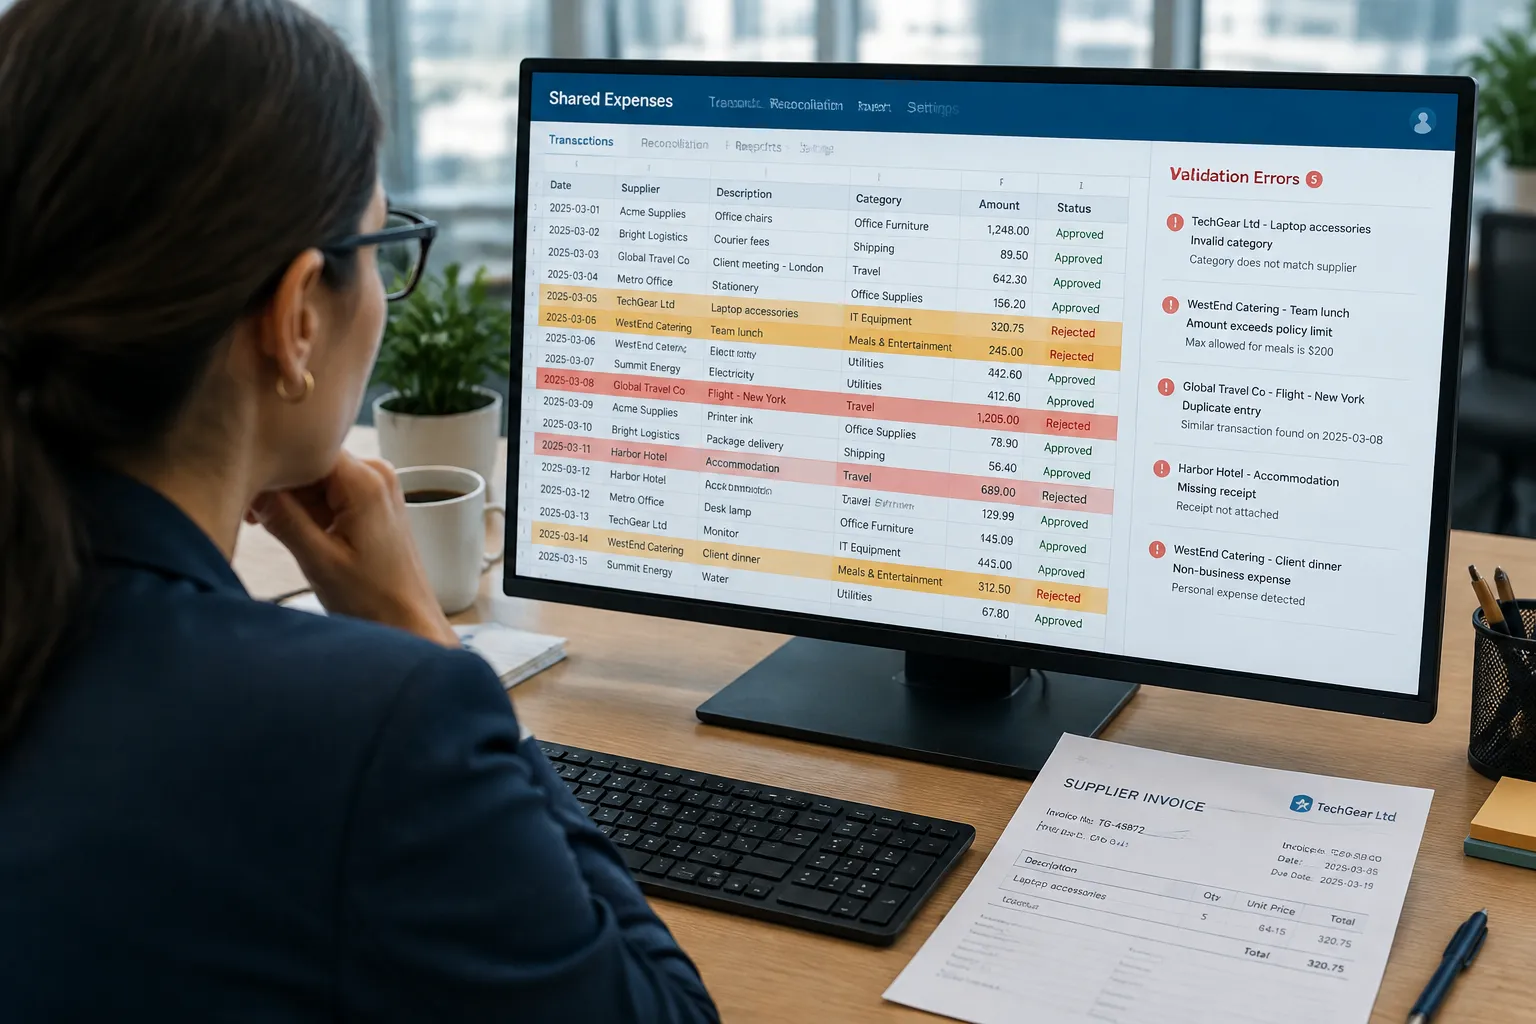
The core idea is simple: never let dashboards read the raw sheet. Put a validation step in between, so that data is either accepted, or quarantined with a reason an owner can act on. Here is the sequence we use, described in plain steps.
Step 1: Land the sheet as a raw, append-only snapshot. Load the sheet into a raw table on a schedule and keep every load with a timestamp. There is a real trade-off here. BigQuery can read a Google Sheet directly through an external table, but that approach shows whatever the sheet contains right now, so when someone overwrites a value or deletes a row, your reporting changes retroactively with no record that it did. For reference lists that people maintain and everybody queries, that can be acceptable. For anything that feeds financial reporting, you want history. Note also that BigQuery does not guarantee data consistency for external tables, which is not a property you want under a number a CFO relies on.
Step 2: Cast defensively in a staging model. Use safe casting so that a bad value becomes a null plus a flag, rather than a failed query. For example, an amount column is cast with SAFE_CAST to numeric, and the model records whether the cast succeeded. Do not fix the data silently here. Record what you found.
Step 3: Apply the rules and assign a status to every row. Each row ends up with a status of valid or quarantined, plus a reason code such as unparseable_amount, unknown_currency, duplicate_key or outside_expected_range. Keep the rules in SQL, in version control, rather than in sheet formulas that nobody can review.
Step 4: Split the output. Valid rows flow into your marts. Quarantined rows go to a separate table that an owner can see. Critically, the dashboard should show a count of quarantined rows and their total value, so leadership sees 'figure excludes 4 rows worth 18,400 pending review' rather than a confident number that is quietly incomplete.
Step 5: Route failures to a named human. An alert that goes to a general channel gets ignored. An alert that says 'Row 212, supplier prepayment, currency code not recognised' sent to the person who owns that sheet gets fixed the same day.
Step 6: Add dbt tests as the backstop. Not-null, unique, accepted-values and relationship tests catch what the staging layer misses and fail the build before bad data reaches a mart. Moving calculations out of spreadsheets and into dbt models eliminated a class of recurring manual errors for one client and cut weekly maintenance time by 30 minutes. If you are earlier in that journey, our view on treating spreadsheet quality as a lifecycle problem rather than a one-off cleanup lines up with the research: prevent at the front end, detect in the middle, reconcile at the back.
One warning from delivery: do not validate by editing the sheet on behalf of the owner. If your pipeline silently corrects values, the sheet and the warehouse drift apart, and you have recreated the problem of two numbers for the same thing. Reject, report, and let the owner fix the source.
Where Should Validation Live: In the Sheet, the Pipeline or an App?
This is the decision most teams get wrong, usually by putting everything in the sheet because that is where the pain is visible. A workable framework:
Layer 1: In the sheet (prevention). Use data validation rules on cells: dropdowns for categories and currencies, number-only columns, date pickers, protected ranges for formula cells, and one input tab separate from calculation tabs. This is free, takes an afternoon, and removes the most embarrassing errors. But it is advisory. Pasting over a cell bypasses the rule, and no one is notified when it happens.
Layer 2: In the pipeline (detection). Everything in the previous section. This is the layer that gives you an audit trail, because every load is kept and every rejection has a reason. It is also the layer that works regardless of how disciplined the person editing the sheet is.
Layer 3: In an app (enforcement). A small internal form or tool that writes to the database directly, with the rules enforced before the record is saved, role-based permissions, and a change log. This is the only layer that makes a bad value impossible rather than detectable.
A rough rule of thumb: start with Layers 1 and 2 for anything low-volume. Move to Layer 3 when the input is high-stakes (it moves money, drives a regulatory report or feeds investor numbers), when more than two or three people edit it, or when you find yourself writing more than a handful of exception rules to cope with how the sheet is used. If you are weighing that last step, we cover the trade-offs in our guide to when custom internal tools beat another SaaS subscription.
If you're looking to implement this in your organisation, explore how Fintel Analytics approaches this. We work with businesses globally to design and deliver exactly this kind of validation layer, from the first audit of your critical sheets through to production pipelines with alerting and ownership built in.
What Does Good Look Like in Practice?
Three outcomes from delivery work illustrate the difference between hoping inputs are right and proving they are.
A reconciliation that stopped being a 30 to 50 minute job. One finance process relied on a manual comparison that took 30 to 50 minutes to run and depended on whoever was doing it that day. We rebuilt it as an automated SQL pipeline that now completes in under 3 seconds. The speed is nice, but the real gain is that the rules run identically every time, so the answer no longer depends on a person's attention.
Weekly reporting without the weekly scramble. An executive report that needed 90 minutes of manual assembly each week was replaced by a live dashboard updated hourly, with zero manual effort. The prerequisite was validated inputs. You cannot safely automate a report built on data you would have eyeballed first.
An expense log that stays in sync without becoming a risk. In an operations hub we built for an e-commerce brand, the team kept their familiar spreadsheet for logging expenses, and the hub kept an expense log in sync with it. That is a deliberate design choice: we did not force a behaviour change on the people entering the data, we made the data safe downstream. Combined with cost of goods and supplier prepayment balances, it let the team see net profit and margin per order, which is the figure that was missing when operations sat across a storefront, a spreadsheet, a supplier inbox and a bank app. For more on that margin problem, see our piece on fixing net profit per order blind spots.
A quick audit you can run this week
Before building anything, spend two hours answering these questions for each sheet that feeds a dashboard:
- Who owns it, and who else can edit it?
- What breaks, and who finds out, if someone pastes text into a numeric column?
- Is there any history, or does the dashboard simply show the current state?
- Is there at least one total that is compared to an independent source?
- If this sheet were wrong by 10%, would anyone notice within a week?
If you cannot answer the last question confidently, that sheet is your first candidate for a validation layer. We often find that two or three sheets carry most of the risk, which keeps the first phase small.

Can AI Help With Manual Data Entry Validation?
Yes, with limits. Deterministic rules should handle everything they can: types, lists, ranges, duplicates, reconciliations. They are cheap, explainable and auditable. Where AI earns its place is the fuzzy part: normalising messy free-text values like supplier names or categories, spotting an unusual entry that no fixed threshold would catch, or drafting a plain-English explanation of why a batch was quarantined for the person who needs to fix it.
The design rule we apply to every AI step in a data workflow is the same one we apply to agents generally: the model proposes, a human approves, and every call is logged and costed. An AI that silently rewrites financial inputs is a new source of bad data, not a fix for it. If you are building this kind of step, our write-up on AI agent approval workflows and audit trails covers how to keep a human in the loop without creating a bottleneck.
Frequently Asked Questions
Q: What is manual data entry validation?
A: It is the practice of automatically checking hand-keyed data against defined rules (type, format, allowed values, range, completeness and consistency) before it is used in reporting. Failing records are flagged or quarantined for review rather than being passed through to dashboards.
Q: How do you validate data entered in Google Sheets?
A: Use three layers: in-sheet data validation rules such as dropdowns and number-only columns to prevent errors, an automated pipeline that checks every load and quarantines failures to detect them, and reconciliation against an independent source such as a bank or provider statement to confirm totals. In-sheet rules alone are not enough because they can be bypassed by pasting over cells.
Q: What are the most common errors in manually entered data?
A: According to a 2026 DOSS Research survey, manual data entry mistakes were the most common error type at 59%, followed by formula errors at 46% and copy-paste issues at 45%. In practice we also see inconsistent category names, duplicated rows, wrong currencies and sign errors on refunds.
Q: When should you replace a spreadsheet with an internal tool?
A: Replace it when the data is high-stakes, when several people edit it, or when you are maintaining a growing list of exception rules to cope with how it is used. A simple internal form that writes directly to your database enforces rules at the point of entry, adds permissions and keeps a change log.
Q: Does data validation slow down reporting?
A: Done well, it speeds it up. Automated checks run in seconds and remove the manual eyeballing that otherwise precedes every report. The trade-off is that some rows will be held back for review, which is the point: a visible, explained gap is safer than a confident but wrong number.
Conclusion
The challenge most growth-stage teams face is not that people make typing mistakes, because they always will. It is that there is nothing between the keyboard and the boardroom to catch them, so manual data entry validation ends up being done by whoever happens to spot something odd. At Fintel Analytics, we have helped fintech, payments and e-commerce teams build exactly this layer, from auditing the sheets that quietly run the business to delivering validated pipelines, quarantine reporting and dashboards leadership can trust. If critical decisions in your company still rest on figures someone typed into a cell, that is a fixable problem, and fixing it before the next board pack or funding round is far cheaper than explaining the error afterwards.