 Fintel Analytics
Crypto Exchange Analytics: Build the Data Stack That Scales
Most crypto exchanges generate enormous volumes of data but operate with surprisingly immature internal analytics. Here's how to fix that — from fee revenue modelling to liquidity dashboards.
Crypto Exchange Analytics: Build the Data Stack That Scales
Crypto exchange analytics refers to the internal data infrastructure that gives exchange operators — not traders — real visibility into fee revenue, liquidity performance, user behaviour, and compliance exposure. Most exchanges generate enormous volumes of transaction data but lack the internal analytics stack to act on it. In 2026, that gap is a direct competitive disadvantage.
This is not a post about on-chain analytics tools for traders or market data vendors for institutional investors. This is about the data stack your team needs to run the business intelligently — and why most crypto platforms at the Series A and B stage are still operating partially blind.
Why Crypto Exchanges Are Drowning in Data but Starved of Insight
The scale of data generated by crypto markets is staggering. Every trade executed on a crypto exchange generates a cascade of data: order book depth, transaction timestamps, wallet addresses, liquidity ratios, and slippage metrics — and multiplied across thousands of trading pairs and millions of daily active users globally, you begin to appreciate the sheer scale of structured and unstructured data being produced around the clock.
Unlike traditional financial markets that operate within defined hours, crypto markets run 24/7, 365 days a year — a continuous data stream that demands infrastructure traditional financial data systems were never designed to handle.
The problem we see repeatedly at growth-stage crypto platforms is not a lack of data. It is the absence of a coherent internal analytics layer sitting above that raw data. The order matching engine is logging every event. The wallet infrastructure is recording every deposit and withdrawal. But when the CFO wants to know what the blended fee yield was last week across spot versus derivatives, or the Head of Operations needs to understand which trading pairs are dragging on liquidity, there is no reliable answer. Finance has one number from a manually maintained spreadsheet. Engineering has another from a raw database query someone ran last month. Leadership does not know who to believe.
This is not an edge case — it is the default state for most crypto platforms between pre-seed and Series B.
One research outlook estimates the broader crypto exchange market at roughly $85.75 billion in 2026 revenue — a market growing fast enough that operating with fragmented internal reporting is genuinely costly. The global crypto exchange market is projected to grow from USD 103.30 billion in 2026 to USD 381.18 billion by 2033, with a 20.5% CAGR. At that trajectory, the analytics infrastructure decisions you make now will either support or constrain your ability to scale.

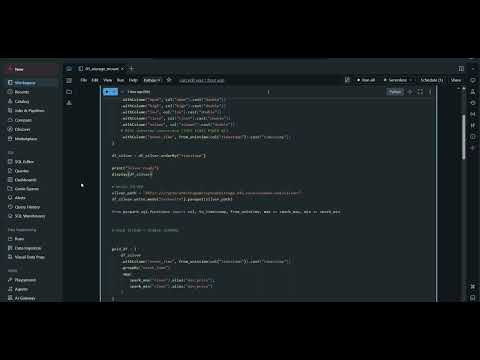
📺 Watch: crypto exchange arbitrage analytics
What Belongs in a Crypto Exchange Internal Analytics Stack?
Before you can design the stack, you need to be clear about what you are actually trying to measure. Internal exchange analytics has five distinct domains, each with different data sources, latency requirements, and stakeholders.
1. Fee Revenue Analytics This is the P&L heartbeat of the exchange. Maker-taker fee structures, tiered volume discounts, withdrawal fees, and spread capture all need to be modelled coherently. The common failure: fee revenue is computed differently in every system — the billing engine uses one calculation, the finance team's spreadsheet uses another, and the executive dashboard was built on a third set of assumptions. The result is a number nobody trusts at month-end.
The fix is to define fee revenue as a single dbt model sitting on top of your raw trade and fee ledger data. Every stakeholder queries the same definition. When the fee schedule changes, you update one place.
2. Liquidity and Order Book Analytics Depth, spread, and fill rate analytics tell you where your market-making is working and where it is not. For exchanges running their own market-making desk or managing relationships with external liquidity providers, this data directly informs capital allocation decisions. Yet at most early-stage exchanges this analysis happens ad hoc — someone runs a SQL query against the order book logs when a problem surfaces, rather than from a persistent model updated continuously.
3. User Behaviour and Cohort Analytics Who are your active traders? What is the 90-day retention rate for users who deposited in their first week versus those who did not? Which acquisition channel produces users with the highest 6-month trading volume? These questions require cohorted event data — typically from your authentication and trading event logs joined with acquisition source data — modelled in a way that allows repeatable analysis. Without this, growth teams make acquisition decisions based on registration counts rather than revenue-weighted user quality.
4. Compliance and Exposure Analytics This is where fragmented data has genuine regulatory and financial consequences. Transaction monitoring systems produce alerts, but the analytics layer that aggregates those alerts into portfolio-level exposure — which users, which assets, which corridors — is often entirely absent. Today's leading exchanges are deploying on-chain analytics engines that can detect wash trading, flag suspicious wallet clusters, and model liquidity risk across correlated assets in real time. If your compliance team is still working from a ticket queue with no aggregate view of risk exposure, you are behind.
For a deeper look at how compliance data infrastructure should be structured, see our post on KYC/AML Compliance Analytics for Fintech: Build It Right in 2026.
5. Operational and Infrastructure Cost Analytics Cloud costs, matching engine throughput, API rate limit consumption, and withdrawal processing SLAs are all operational metrics that affect margin. As the crypto market grows more competitive and complex, exchanges are under increasing pressure to provide faster execution, stronger security, better compliance, and more personalised user experiences. None of that is manageable without operational data products for your engineering and infrastructure teams.
The Architecture That Actually Works at Series A–B Scale
At the growth stage — typically 20 to 100 people, multiple product lines, and accelerating transaction volume — the right architecture is not the most sophisticated one. It is the one that ships, stays maintained, and actually gets used.
Here is what we build and why:
Ingestion layer: Raw data from your trade engine, wallet infrastructure, user authentication system, and compliance tooling lands in a cloud data warehouse. BigQuery works well for high-frequency event data at this scale — its columnar storage handles the append-heavy write patterns of trading event logs efficiently, and the cost model is manageable if you implement query governance from the start. (A pattern we see repeatedly: exchanges that ingest tick data without partitioning or clustering strategies watch their query costs multiply quarter-on-quarter as table sizes grow.)
Transformation layer: dbt models sit above the raw ingestion layer and produce clean, tested, documented semantic entities: fct_trades, fct_fees, fct_withdrawals, dim_users, dim_assets. These models enforce your business definitions — what counts as an "active trader", what qualifies as a "completed withdrawal", how you calculate "net fee revenue" after rebates. Every analyst and stakeholder queries from these models, not from raw tables.
Semantic layer: A SQL semantic layer — either Holistics BI (where Fintel Analytics is an official partner) or a Looker-based approach — sits above dbt and exposes governed metrics to business users. This is where you define daily_active_traders, blended_maker_fee_yield, 30d_withdrawal_volume_by_asset as reusable, consistent metrics — so the same number appears in every dashboard, every report, and every investor update.
BI layer: Operational dashboards for finance, compliance, and growth. Not a single monolithic dashboard — distinct data products built for the actual workflow of each team. Finance gets a fee revenue and margin dashboard updated hourly. Compliance gets an exposure and alert volume dashboard with drill-down to user level. Growth gets cohort retention and acquisition quality views.
If you are designing this stack from scratch or rebuilding one that has grown organically and broken, explore how Fintel Analytics approaches this — we work with crypto and digital asset businesses globally to design and deliver exactly this kind of solution, from initial data audit through to production deployment.

What the Data Actually Tells You — and What You Are Missing Without It
The most common objection we hear from crypto founders at Series A is: "We're moving too fast to invest in data infrastructure right now." This is precisely backwards. The faster you are moving, the more expensive the decisions made on bad data become.
Here is a concrete example. A crypto trading platform we worked with had a fee revenue figure it reported to investors each month. When we modelled the fee ledger properly — accounting for maker rebates, tiered discounts applied inconsistently across trading pairs, and a set of promotional zero-fee periods that were never excluded from the calculation — the actual net fee revenue was materially different from the number being reported. Not because of fraud or intent, but because no one had ever built a coherent definition of "net fee revenue" into a maintained data model. The calculation lived in a spreadsheet, and the spreadsheet had grown too complex for anyone to audit confidently.
This is a problem with a straightforward fix. But finding it requires first knowing it exists — and you only know it exists if you have the data infrastructure to surface it.
Another pattern: exchanges that track trading volume as the primary KPI without decomposing it by user cohort, asset class, and fee tier. Businesses should avoid treating trading volume as a direct measure of adoption — looking at adoption, liquidity, stablecoin supply, derivatives activity, and exchange concentration together provides a much clearer picture of the market. The same principle applies internally: raw volume is a vanity metric without the decomposition layer beneath it.
As competition intensifies, exchanges that successfully integrate data-driven features may gain a significant advantage in user retention and operational efficiency. The exchanges that will win at Series B and beyond are the ones that can answer, in real time: which users are profitable, which assets are margin-dilutive, and where operational cost is being destroyed by process inefficiency.
For exchanges handling stablecoin flows as part of their product mix, these analytics challenges compound significantly — the data normalisation required across fiat-pegged assets and the reconciliation complexity are substantial. See our post on Stablecoin Payments Analytics: Build the Data Stack That Works for more on that specific problem.
The Three Mistakes Crypto Platforms Make With Their Data Stack
Mistake 1: Building for the trading engine, not the business Most early-stage exchanges have excellent engineering on the matching engine and wallet infrastructure. The data infrastructure that serves the business — finance, compliance, growth — is treated as an afterthought. The result is a technically sophisticated product with operationally blind leadership.
Mistake 2: Conflating raw data access with analytics capability Giving analysts access to the production database is not the same as having analytics infrastructure. Raw access without transformation, documentation, and governance produces ad-hoc query culture — every analysis is bespoke, results are inconsistent, and no one trusts any number they did not produce themselves.
Mistake 3: Letting compliance analytics lag operational growth Crypto hackers stole $3.4 billion across 2025, a 55% jump from $2.2 billion in 2024. The FBI's Internet Crime Complaint Center logged $11.36 billion in cryptocurrency fraud losses for 2025. The compliance data infrastructure required to operate safely at scale — transaction monitoring aggregation, exposure modelling, alert triage analytics — is a serious engineering problem. Exchanges that treat it as a compliance team problem rather than a data engineering problem will either face regulatory action or operational failure as volume grows.
Frequently Asked Questions
Q: What is crypto exchange analytics?
A: Crypto exchange analytics refers to the internal data infrastructure and reporting systems that exchange operators use to monitor fee revenue, trading volume, user behaviour, liquidity performance, and compliance exposure. It is distinct from on-chain analytics tools used by traders or investors — the focus is on running the exchange as a business with accurate, timely, and trusted data.
Q: What data sources does a crypto exchange analytics stack typically include?
A: The primary sources are the trade matching engine (order and fill events), wallet and custody infrastructure (deposits, withdrawals, balances), user authentication and KYC systems, fee ledger and billing systems, and compliance/AML tooling. These sources are ingested into a cloud data warehouse, transformed using dbt, and exposed through a semantic layer and BI dashboards.
Q: How should a crypto exchange calculate net fee revenue accurately?
A: Net fee revenue should be modelled as a single, documented dbt transformation applied consistently to the raw fee ledger — accounting for maker rebates, tiered volume discounts, promotional zero-fee periods, and any revenue-sharing arrangements with liquidity providers. Every variation in the calculation should be version-controlled and auditable, not maintained in a spreadsheet.
Q: When should a crypto exchange invest in a proper data warehouse?
A: As soon as transaction volume makes ad-hoc database queries materially slow, inconsistent across teams, or difficult to audit — typically from Series A onwards. The cost of building correctly at this stage is significantly lower than the cost of rebuilding after a compliance incident, an investor due diligence process, or an operational failure caused by bad data.
Q: What BI tools work best for crypto exchange internal reporting?
A: The most robust stacks at growth-stage exchanges combine BigQuery or Redshift for warehousing, dbt for transformation, and either Holistics BI or Looker for governed metric exposure and dashboarding. The key requirement is a semantic layer that enforces consistent metric definitions across all dashboards — so fee revenue, active users, and withdrawal volume mean exactly the same thing in every report.
Running a crypto exchange without a coherent internal analytics stack in 2026 is not a data problem — it is a business risk. Inconsistent fee revenue figures, compliance exposure that is invisible until it becomes a regulatory event, and growth decisions made on trading volume without user-quality decomposition are all consequences of treating data infrastructure as a back-office concern. At Fintel Analytics, we have helped digital asset platforms and fintech businesses at Series A and B build exactly the kind of data stack described in this post — from the initial data model design through to live operational dashboards that finance, compliance, and growth teams actually use every day. If your team is making decisions from fragmented queries and spreadsheets that no one fully trusts, that is a solvable problem, and solving it has a measurable return.