Cash flow forecasting analytics is the discipline of building automated, trustworthy data pipelines that give finance and treasury teams a single, reliable view of cash position, cash flow drivers, and forward liquidity — replacing manual spreadsheet models with governed, version-controlled data infrastructure. When it works, CFOs stop flying blind. When it does not, the consequences are measurable and expensive.
The hard truth most analytics vendors will not tell you is this: the problem is almost never the forecasting model. It is the data underneath it. Fragmented bank feeds, manually keyed AR/AP figures, ERP extracts that arrive hours late, and spreadsheets held together by conditional formatting — these are what break cash forecasts. Fix the data infrastructure, and forecast accuracy follows. Ignore it, and no tool on the market will save you.
This is what we see consistently in our work with growth-stage fintechs, payments businesses, and financial services companies. The failure mode is not a missing algorithm. It is a missing data foundation.
Why Does Cash Flow Forecasting Keep Getting It Wrong?
The structural problems are well documented but rarely addressed at root cause. The structural problems with traditional cash forecasting are understood by every treasurer who has built a 13-week cash model in a spreadsheet: data arrives late, in inconsistent formats, from dozens of sources; payment timing is erratic; seasonal patterns are hard to model manually; and by the time the forecast is assembled each morning, the inputs it was built on are already hours old.
Traditional approaches — spreadsheet models fed by manual data pulls from banking portals, ERP systems, and subsidiary reports — produce 30-day cash forecasts that are off by 15–25% on average, forcing treasurers to maintain larger precautionary cash buffers and forgo higher-yield investment opportunities.
The downstream cost is not abstract. According to Agicap's 2025 survey of US mid-sized companies, the average cost of unreliable cash flow forecasts amounts to $465,000 annually — and 43% of US mid-market companies admit to relying on unreliable forecasts, leading to unexpected cash deficits of over $50,000 every 20 days on average.
In our own delivery work, the pattern is almost identical across company size and geography. A Series B fintech came to us with a treasury team spending three mornings per week manually consolidating bank positions from six banking providers, two payment processors, and an ERP that only synced overnight. Their "13-week forecast" was effectively a 13-week guess, with a stale snapshot at its core. They knew it. The board knew it. But nobody had framed it as a solvable data engineering problem — only as a finance process problem.
That distinction matters enormously. Finance process problems get addressed with better spreadsheet templates or hiring another FP&A analyst. Data engineering problems get addressed by building a pipeline.

📺 Watch: A level Business Revision - Cash Flow Forecasts

What Does a Broken Cash Forecasting Data Stack Actually Look Like?
Before you can fix it, you need to name the specific failure modes. In practice, we see six recurring patterns:
1. Multiple banking relationships with no unified feed. Data arrives via CSV download, SFTP, or manual portal login — at different times, in different formats, with different field names for the same concept. There is no single source of truth for opening balances.
2. AR and AP data living in the ERP with no validated extraction layer. Finance teams pull ageing reports manually and paste them into a forecast template. Nobody has built a validated SQL model that guarantees those figures reconcile back to the ledger.
3. No timestamp discipline. "Yesterday's closing balance" means something different in every system. Without explicit timestamp governance in your data models, you cannot answer the question: what is my cash position right now, and as of what exact point in time?
4. The forecast model is owned by one person. When that person is on leave, nobody can update it. This is not a management problem. It is a data product problem — the forecast logic exists in an Excel file in someone's OneDrive, not in a governed dbt model with version history and CI checks.
5. No variance tracking. Most teams produce a new forecast each week and forget the old one. Without systematic actual-versus-forecast variance tracking in your data warehouse, you cannot improve model accuracy over time — you have no feedback loop.
6. Currency and entity consolidation done manually. For companies with multi-currency operations — which at Series A and beyond increasingly includes most of our clients — consolidating USD, EUR, GBP, and SGD positions into a group-level view involves manual FX lookups and copy-paste. This is where material errors enter.
Many treasury teams are held back by fragmented banking relationships, legacy systems, and manual processes — and forecast variances exceeding 20% alongside excessive liquidity buffers of 15–20% are symptoms of these outdated tools.
The fix is not a new forecasting platform. The fix is building the data infrastructure those platforms depend on — and which, at growth-stage companies, usually does not exist yet.
How Do You Build a Cash Forecasting Data Pipeline That Actually Works?
This is where we spend the most time with clients, and it is where the leverage is. The architecture is not complicated, but the execution discipline is.
Step 1: Consolidate your bank feeds into a single ingestion layer. Whether you are pulling from banking APIs, SFTP file drops, or ERP connectors, the first requirement is landing all source data into a single data warehouse — BigQuery or AWS Redshift are the most common at the companies we work with — with consistent schema, explicit timestamps, and no manual steps. Automate this fully. If a human has to do anything to make morning data available, you have a fragility point.
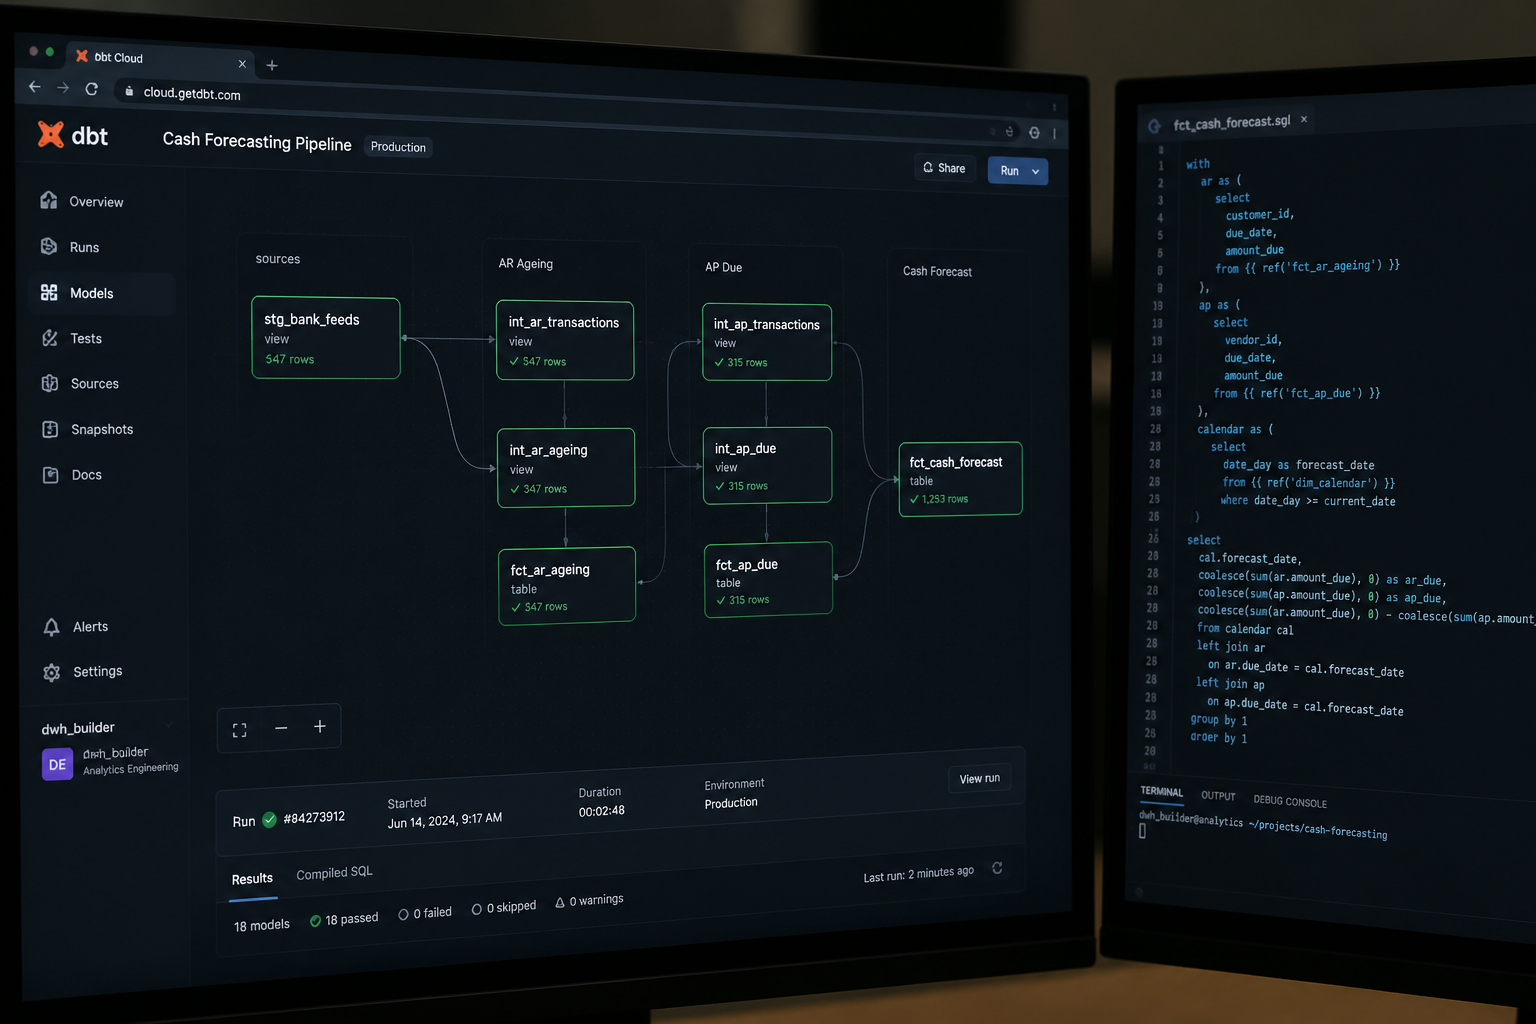
Step 2: Build validated SQL models in dbt for your core financial entities. Your "cash position" model, your "AR ageing" model, your "AP due" model — these should be defined once, in version-controlled dbt code, with tests that run on every refresh. When the same metric shows different numbers in different reports (and it will, until you do this), the answer is a governed semantic layer, not a longer email thread between finance and ops.
In one client engagement — a global payments company operating across seven currencies — we migrated all core treasury calculations out of a shared Google Sheet and into dbt models running on BigQuery. The result was that a capital reconciliation process which had been producing inconsistent balances for months was replaced by a single, tested model. The first run surfaced a $25M discrepancy that had gone undetected. At market borrowing rates, that gap was costing the business over $6,000 per day.
Step 3: Define your forecast model in the semantic layer, not in a spreadsheet. The forecast logic — rolling 13-week projection, payment timing rules, expected collections waterfall — should live in your semantic layer (we typically implement this in Holistics BI or dbt metrics, depending on the client's stack). This means: one definition, consistent everywhere, no manual override risk, auditable history.
Step 4: Build variance tracking as a first-class data product. Every forecast run should be snapshotted and stored alongside actuals. Your dbt model should compute actual-versus-forecast variance at the cash flow category level — receivables, payables, payroll, capex — so you can see which categories are systematically off and tighten the model over time. Variance analysis that compares actual cash flows against forecasts helps teams quickly identify deviations and adjust plans accordingly.
Step 5: Surface the output in a live dashboard, not a weekly report. A treasury dashboard updated hourly tells a completely different story to a Monday morning PDF. In our delivery work, we have replaced weekly executive reporting that required 90 minutes of manual preparation with live dashboards that update on an automated schedule — zero manual effort, and leadership can check position at any point during the week without waiting for finance to compile something.
If you are looking to implement this kind of infrastructure in your organisation, explore how Fintel Analytics approaches treasury and finance data engineering — we work with fintech, payments, and financial services businesses globally to design and deliver exactly this kind of solution.
When Does a Growth-Stage Company Actually Need This?
This is the question founders and CFOs most commonly ask us, and the honest answer is: earlier than you think, later than the purists suggest.
The trigger is not headcount or funding stage — it is operational complexity. Specifically, you need a proper cash forecasting data pipeline when any of the following are true:
- You have more than two banking relationships or payment providers
- You operate in more than one currency
- Your forecast is owned by one person and breaks when they are unavailable
- Your board asks for a cash bridge and it takes more than two hours to produce
- Your payment reconciliation and your cash forecast are maintained in separate spreadsheets that do not talk to each other
For most Series A companies, at least three of these are true. For most Series B companies, all five are. At pre-seed, a well-maintained spreadsheet is usually sufficient. The moment you start raising external capital and reporting to investors on runway and liquidity, you need your numbers to be defensible at the data level — not just at the assumption level.
In 2026, AI is reshaping treasury cash management at a pace that has surprised even early technology adopters — AFP's 2026 Annual Treasury Technology Survey found that 52% of US corporate treasurers are piloting or have deployed AI for cash forecasting, a figure that has nearly doubled in two years. But those AI models are only as useful as the data infrastructure feeding them. Deploying a machine learning forecasting layer on top of a manually assembled spreadsheet pipeline is like fitting a GPS to a car with no fuel gauge.
ML models are only effective if they are powered by timely, accurate data. Before any growth-stage company should be thinking about AI-enhanced forecasting, they should be asking whether their underlying data pipeline is automated, validated, and trustworthy.
What Does Good Look Like? A Decision Framework
Below is the framework we use to assess a client's cash forecasting data maturity. Use it to score your own current state:
Level 1 — Manual: Cash position assembled daily/weekly by a finance team member. Bank data pulled manually. Forecast lives in Excel or Google Sheets. No version control. Variance tracking non-existent. Typical stage: pre-seed to early Seed.
Level 2 — Semi-Automated: Some bank feeds connected via ERP or treasury tool. Forecast still in a spreadsheet but partially formula-driven. Single owner. No systematic variance analysis. Typical stage: Seed to Series A.
Level 3 — Automated Pipeline: All bank and payment data ingested automatically into a data warehouse. Core financial models in dbt. Cash dashboard live and self-refreshing. Variance tracked systematically. Forecast logic version-controlled. Typical stage: Series A to B — this is the target state.
Level 4 — Predictive Analytics: ML models layered on top of a clean data foundation, learning payment timing patterns, seasonal curves, and collection probability. Scenario planning built into the dashboard. Automated alerting on variance breaches. Typical stage: Series B and beyond, or high-complexity Seed-stage fintechs.
Most of the clients we onboard sit between Level 1 and Level 2. The journey to Level 3 is almost always achievable within a single sprint cycle when the right data engineering approach is applied — and the ROI is immediate. One organisation that made this transition gained a reliable, real-time view of liquidity every single day, replacing manual estimates with certainty — while automation slashed the manual workload from 32 hours a week down to just 2, unlocking over 1,200 hours of added value per year.
For payments businesses specifically, the intersection of cash forecasting and reconciliation is where the largest value is unlocked — if you have not already, it is worth reading our piece on Payments Reconciliation Analytics: Automate & Scale in 2026, which covers the adjacent problem of settlement data quality.
Frequently Asked Questions
Q: What is cash flow forecasting analytics?
A: Cash flow forecasting analytics is the use of automated data pipelines, SQL data models, and business intelligence tools to produce accurate, real-time projections of future cash positions. Unlike spreadsheet-based forecasting, it relies on governed, validated data from banking, ERP, and payment systems — delivering forecasts that are auditable, repeatable, and continuously updated.
Q: Why is my cash flow forecast inaccurate?
A: In most cases, forecast inaccuracy is a data infrastructure problem, not a modelling problem. The most common causes are stale or manually assembled bank data, unvalidated AR/AP figures, inconsistent timestamps across source systems, and forecast logic owned by a single person in an unversioned spreadsheet. Fixing the data pipeline almost always improves forecast accuracy more than refining the model.
Q: How do I automate cash flow forecasting?
A: Automation requires three components: an ingestion layer that pulls bank, ERP, and payment data into a central data warehouse automatically; validated SQL models (typically built in dbt) that define cash positions and forecast drivers consistently; and a live BI dashboard that surfaces the forecast in real time. Tools like BigQuery, dbt, and Holistics BI form a robust stack for growth-stage companies.
Q: What is the typical cash flow forecast accuracy for growth-stage companies?
A: Traditional spreadsheet-based approaches typically produce 30-day forecasts that are off by 15–25% on average (ChatFin/AFP data, 2026). Well-implemented analytics pipelines with clean data foundations can achieve materially higher accuracy — industry benchmarks for AI-augmented forecasting cite figures of 90% or above, though this depends heavily on data quality and historical depth.
Q: When should a startup invest in a proper cash forecasting data pipeline?
A: The trigger is operational complexity, not funding stage. If you have more than two banking relationships, operate in multiple currencies, or your board is asking for cash bridge analysis, you need a proper pipeline. For most Series A companies, the manual approach is already causing material risk. The typical build time for a governed cash forecasting pipeline with dbt and BigQuery is four to eight weeks.
If your finance team is spending hours each week manually assembling a cash position that is already out of date by the time it reaches the board, that is not a resourcing problem — it is a data architecture problem, and it is entirely fixable. At Fintel Analytics, we have helped fintech, payments, and financial services companies at every stage from Seed through Series B build automated, trustworthy cash forecasting infrastructure — moving them from fragile spreadsheets to governed pipelines that give treasury teams real-time visibility and give leadership the confidence to make capital decisions on solid ground. The cost of bad cash visibility compounds daily. The fix does not have to.