What Is a B2B SaaS Metrics Stack (And Why Does Yours Probably Need Rebuilding)?
A B2B SaaS metrics stack is the combination of data pipelines, transformation models, and BI layer definitions that produce your core growth metrics — ARR, NRR, logo churn, expansion revenue, CAC payback, and cohort retention — from source data. Most early-stage companies do not have one. They have a spreadsheet maintained by one person in finance, a CRM report that does not match it, and a Stripe dashboard that contradicts both. If that sounds familiar, the problem is not your data. It is your architecture.
This post is a practitioner's guide to building a metrics stack that survives from seed through Series B — the right models, the right tooling decisions, and the specific mistakes that cause otherwise well-run SaaS businesses to lose trust in their own numbers at exactly the moment investors start asking hard questions.
Why Do B2B SaaS Metrics Break Down at Scale?
The pattern we see repeatedly in our work with early-stage SaaS companies is this: a founder or head of finance builds a revenue model in Google Sheets during the early months, and it works — until it doesn't. By the time the business reaches £2–5M ARR, that spreadsheet is doing work it was never designed to do. It is pulling from Stripe via a manual export, cross-referencing a CRM dump, applying custom logic for multi-year contracts and usage-based upsells, and being manually updated by someone who is also doing six other jobs. The sheet is fragile, the logic is undocumented, and every time a formula breaks, the business goes blind.
The metrics that break first are always the same: NRR (because it requires accurate cohort segmentation across billing periods), logo churn (because it depends on correctly identifying contraction versus true churn), and CAC payback (because it requires joining marketing spend data to correctly attributed new ARR). These are precisely the metrics that investors scrutinise most closely at Series A and Series B.
The technical root cause is almost always one of three things:
1. No single definition of a subscription event. Your billing system, CRM, and product database each have their own concept of when a customer "started," "renewed," or "churned." Without a canonical event model sitting upstream of all your metrics, every dashboard will show a different number.
2. ARR logic embedded in the BI layer, not the transformation layer. When ARR calculations live inside a Looker explore or a Holistics report rather than a dbt model, you cannot test them, version them, or reuse them. Every analyst redefines the metric slightly differently, and the divergence compounds over time.
3. No treatment of contract complexity. Multi-year deals, mid-period upsells, price changes, and usage-based components each require specific handling. A naive monthly-revenue-times-12 approach to ARR is wrong the moment any of those conditions exist — and in B2B SaaS, they always exist.
📺 Watch: Maximizing B2B Partnerships with SaaS Creator Stacks by Toksta
What Does a Properly Engineered SaaS Metrics Stack Look Like?
At Fintel Analytics, the architecture we deliver for SaaS clients typically has four layers, each with a specific responsibility.
Layer 1: The Subscription Event Model
Everything starts with a clean, normalised event stream of subscription state changes. Every time a customer signs, expands, contracts, or churns, that is an event with a timestamp, a customer ID, an ARR delta, and a reason code. This model is built in dbt, sourced from your billing system (Stripe, Chargebee, or equivalent), and validated against your CRM on every run.
The critical design decision here is the ARR date convention: do you recognise ARR at contract signature, billing date, or go-live? There is no universally correct answer, but there must be one answer, documented and enforced in the model — not decided anew each time someone builds a report.
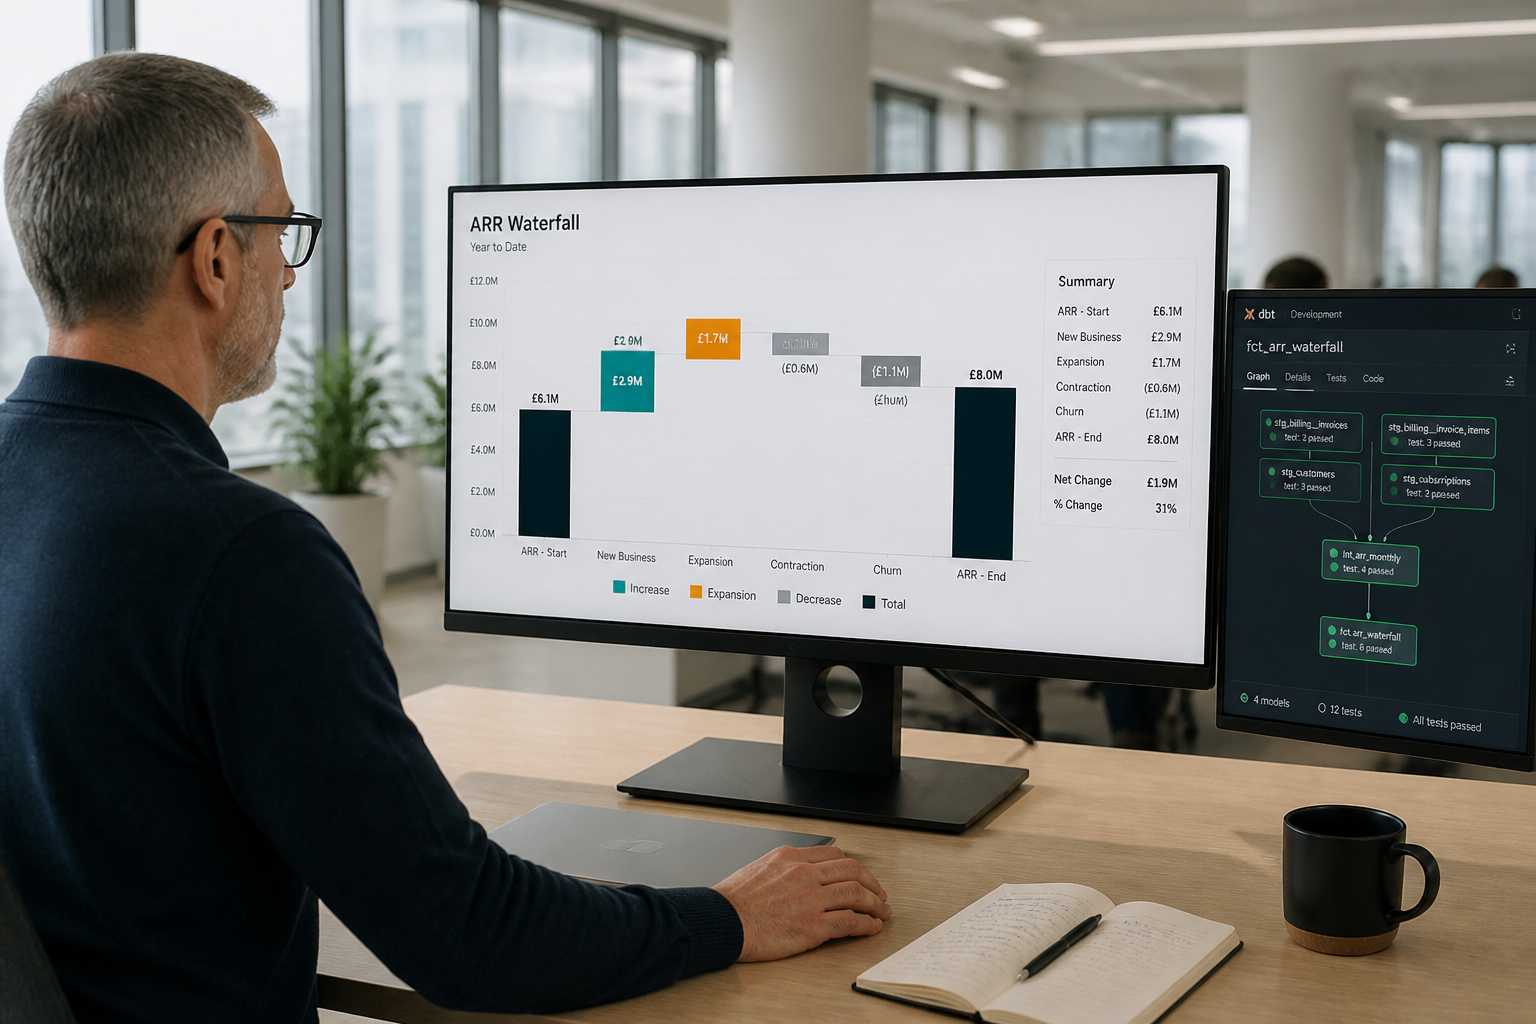
Layer 2: The ARR Waterfall Model
Once you have a clean event stream, you can build the ARR waterfall — the month-by-month decomposition of ARR into new business, expansion, contraction, churn, and reactivation. This is the model that drives your board reporting, investor updates, and cohort analysis. It belongs in dbt, tested with schema and business logic tests on every run, and materialised as a table that every downstream BI report queries.
Migrating calculations from spreadsheets into dbt models eliminates a class of recurring manual errors. In one engagement with a Series A SaaS company, moving the ARR waterfall from a manually maintained Google Sheet into a tested dbt model cut weekly finance maintenance time by 30 minutes and surfaced a classification error that had been overstating expansion revenue by approximately 8% for three months.
Layer 3: The Cohort and Retention Layer
NRR and gross revenue retention (GRR) require cohort-level analysis — tracking each customer's ARR from their first month through every subsequent period. This is straightforward in SQL but requires careful thought about how you handle mid-cohort contract changes. The model we build for most clients uses a customer-month grain, joining the ARR waterfall to a cohort assignment table, and produces both logo-level and ARR-weighted retention curves.
This layer is where the value of a SQL semantic layer becomes apparent. If your NRR definition lives in a tested dbt model with documented logic, you can confidently say to an investor: "Our NRR is calculated this way, it is tested on every pipeline run, and you can audit the SQL." That level of rigour is increasingly expected at Series A and above. For a deeper dive into why metric definitions in the BI layer keep breaking, see our post on SQL Semantic Layer: Why Your Metrics Are Broken in 2026.
Layer 4: The BI and Operational Reporting Layer
With clean, tested models in the transformation layer, the BI layer becomes straightforward — and fast to maintain. We typically deliver this in Holistics BI or Looker, depending on the client's existing stack. The key principle is that the BI layer should contain no business logic — it should only filter, visualise, and present what the dbt models have already defined. If an analyst needs to change the definition of "churned customer," they change it in dbt, run the tests, and every dashboard that uses that model updates automatically. No manual corrections, no divergent definitions.
If you are looking to implement this kind of stack in your organisation, explore how Fintel Analytics approaches this — we work with SaaS businesses globally to design and deliver exactly this kind of solution, from data model design through to production BI deployment.
Which Metrics Actually Belong in the Stack — and Which Are Distractions?
One of the most common mistakes we see in early-stage SaaS analytics is metric proliferation. Founders read a post about the 40+ SaaS metrics they should be tracking and build dashboards for all of them, none of which are trusted by anyone because they are all calculated differently from different source tables.
For a pre-Series B SaaS business, the metrics that actually drive decisions — and that need to be in the stack, correctly defined and tested — are a short list:
- ARR and MRR, decomposed into new, expansion, contraction, and churn
- NRR and GRR, at both logo and revenue level, with 12-month trailing cohort view
- Logo churn rate, with a consistent definition of what constitutes a churned customer versus a contracted one
- CAC payback period, which requires marketing spend data joined to correctly attributed new ARR by cohort
- ACV by segment and channel, which requires deal-level CRM data joined to billing
- Time to first value / onboarding completion rate, if product instrumentation is available
Nothing else needs to be in the core stack at seed or Series A. Everything else is a distraction until these six are clean, trusted, and automated.
A pattern we see repeatedly: companies investing in complex product analytics dashboards while their ARR waterfall is still a manually-updated spreadsheet. Fix the revenue metrics first. Everything else depends on them.

How Do You Know When Your SaaS Metrics Stack Is Actually Working?
There are three tests we use with clients to determine whether a metrics stack is production-ready.
The single-source test. Ask three people in your organisation — the CEO, the CFO, and a sales leader — what your current ARR is. If they give different numbers, your stack is not working. This is not a people problem; it is an architecture problem.
The audit trail test. If an investor asks you to explain how your NRR is calculated, can you point to a documented SQL model with version history? If the answer is "let me walk you through the spreadsheet logic," you have a problem that will slow down or complicate your fundraise.
The maintenance test. How long does it take to produce your monthly board pack? If the answer involves more than 30 minutes of manual work, the stack is not automated enough. Weekly executive reporting that required 90 minutes of manual work is solvable — we have replaced that exact process with a live dashboard updated hourly, requiring zero manual effort.
What Stack Should You Actually Build On?
For most Series A and pre-Series A SaaS companies, the right stack is not complicated. The components that consistently deliver the best price-to-performance ratio for this stage are:
- BigQuery as the cloud data warehouse — cost-effective at moderate data volumes, excellent SQL performance, and native integration with dbt and most BI tools
- dbt (data build tool) for all transformations — version-controlled, tested, documented models that your whole team can read and trust
- Fivetran or Airbyte for data ingestion from Stripe, HubSpot, Salesforce, and your product database
- Holistics BI or Looker for the reporting layer — Holistics in particular offers a code-based modelling approach that keeps business logic out of the BI layer
The decision to build on this stack versus a more heavyweight enterprise alternative (Snowflake, Databricks) comes down to data volume and team size. At under 50 people with under $10M ARR, the simpler stack is almost always the right call. The overhead of managing a Databricks environment is not justified by the analytics requirements of a Series A SaaS business.
For guidance on keeping your transformation layer performant as data volumes grow, our post on Why Your dbt Models Are Running Slow — And How to Fix It covers the specific query patterns that cause costs to spiral.
Frequently Asked Questions
Q: What is a B2B SaaS metrics stack?
A: A B2B SaaS metrics stack is the combination of data pipelines, transformation models (typically built in dbt), and a BI reporting layer that together produce your core growth metrics — ARR, NRR, churn, cohort retention, and CAC payback — from authoritative source systems. It replaces manual spreadsheet-based reporting with automated, tested, version-controlled pipelines that produce a single source of truth.
Q: When should a SaaS startup invest in a proper metrics stack?
A: The right trigger is usually when your ARR waterfall, NRR, or churn figures are showing different numbers in different places, or when preparing investor reports requires more than 30 minutes of manual work each month. For most companies, this becomes urgent between £1–3M ARR — before the Series A process begins, not during it.
Q: How do you calculate NRR correctly in a SaaS business?
A: NRR (Net Revenue Retention) is calculated by taking the ARR from a given cohort at the start of a period, then measuring that same cohort's ARR at the end of the period — including expansion and contraction but excluding any new logos. The result is expressed as a percentage. The most common error is including new logo ARR in the numerator, which inflates the figure. The calculation should be defined and tested in a dbt model, not embedded in a spreadsheet or BI tool.
Q: What is the difference between logo churn and revenue churn in SaaS?
A: Logo churn counts the percentage of customers who cancelled during a period, regardless of their ARR. Revenue churn (or gross revenue churn) measures the percentage of ARR lost from cancellations and contractions. A company can have low logo churn but high revenue churn if its largest customers are contracting, or vice versa. Both metrics belong in the stack with consistent, documented definitions.
Q: Should ARR calculations live in dbt or in the BI layer?
A: Always in dbt (or an equivalent SQL transformation layer). Business logic embedded in BI tools — Looker, Holistics, Power BI — is hard to test, version, and audit. When ARR logic lives in dbt, it is covered by automated tests, documented in code, and shared consistently across every dashboard and report that references it. If two dashboards ever show different ARR figures, the root cause is almost always logic that was defined in the BI layer rather than the transformation layer.
If your ARR lives in a spreadsheet, your NRR shows different numbers in different places, or your board pack takes half a day to produce each month, you are carrying technical debt that will become a serious problem the moment an investor starts due diligence. At Fintel Analytics, we have built SaaS metrics stacks for pre-seed through Series B companies across fintech, payments, and B2B software — from initial data model design through to production BI deployment with full documentation and testing. The fix is almost always faster and less disruptive than founders expect, and the clarity it creates is immediate.