 Fintel Analytics
Spend Analytics for Finance Teams: Fix Your Data in 2026
Most finance teams have spend management tools — but still can't answer basic questions about where money is going. Here's why, and how to fix it.
Spend Analytics for Finance Teams: Why Your Spend Data Is Broken (And How to Fix It)
Spend analytics for finance teams means building a reliable, joined-up data layer that connects card transactions, supplier payments, budgets, and cost centres — and turning that into decisions, not just reports. Most growth-stage companies already have a spend management tool. The problem is not the tool. The problem is what happens to the data after the transaction clears — and the answer, in most cases, is not very much.
If your head of finance can tell you the total spent last month but cannot tell you which cost centre is running 23% over budget, which supplier accounts for the highest month-on-month variance, or why the marketing team's AWS spend is being coded to three different GL accounts depending on who submits the receipt — your spend analytics is broken. That is not a Ramp problem or a Brex problem. It is a data architecture problem, and this post explains exactly how to fix it.
Why Growth-Stage Finance Teams Cannot Answer Basic Spend Questions
The pattern we see repeatedly in our work with Series A and Series B companies is this: the company has invested in a modern spend management platform, has corporate cards issued to the team, and has approval workflows in place. Yet the head of finance is still building the board spend pack in Google Sheets every month, manually pulling CSVs from three different sources, applying vlookups to match supplier names that have been keyed differently each time, and hoping nobody has edited the formula in column Q.
The root cause is almost always the same. Spend management platforms — even excellent ones — are designed to capture and control spending. They are not designed to be the analytical layer your finance function needs. They produce transaction-level exports, and someone in finance then tries to build reporting on top of raw, uncleaned, unnormalised data.
The consequences compound quickly. Merchant names arrive inconsistently from card networks — "AMZN" and "Amazon Web Services" and "Amazon" may all be the same supplier in reality but look like three distinct vendors in your export. Cost centre codes get applied manually during receipt submission, which means they reflect whatever the employee guessed, not what your finance team intended. Budget vs actual comparisons require a separate spreadsheet because the spend platform has no awareness of your internal budget structure. And currency conversion, for teams with international spend, is typically applied at the transaction-level spot rate rather than the monthly average rate your finance team uses for reporting.
None of this is unsolvable. But it requires deliberate data engineering — not another dashboard bolted onto raw exports.

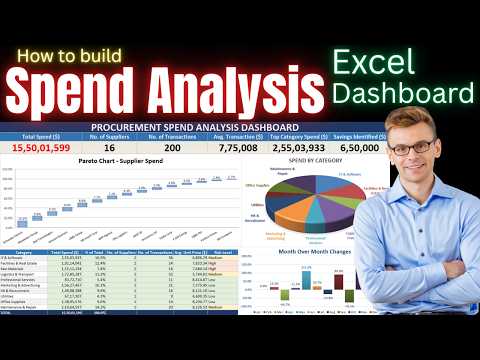
📺 Watch: Procurement Spend Analysis in Excel | Supplier Risk Analysis | Download Excel For Procurement
What Does Good Spend Analytics Actually Look Like?
A well-architected spend analytics stack answers three tiers of questions that most finance teams cannot currently answer from a single source:
Tier 1 — Operational visibility (weekly cadence) Which departments are tracking ahead of or behind budget by cost centre? Which individual cardholders have uncategorised transactions older than 48 hours? Are there any transactions that have been miscoded to the wrong entity in a multi-entity structure?
Tier 2 — Strategic analysis (monthly cadence) What is the run-rate spend by supplier category, and how has that trended over the last six months? Which vendor relationships are growing as a share of total spend without a corresponding contract review? Where is duplicate spend occurring — subscriptions or tools that multiple teams are purchasing independently?
Tier 3 — Executive and investor reporting (board cadence) What is the total OpEx burn by function, and how does that compare to the headcount plan? What is the fully-loaded cost per revenue unit by channel? Where are the top three controllable spend levers heading into the next quarter?
Right now, most growth-stage finance teams can answer Tier 1 questions — imperfectly and with manual effort. Tier 2 requires significant spreadsheet work and is often done quarterly at best. Tier 3 is typically produced by a founder or CFO manually pulling numbers from four or five sources in the week before the board meeting.
Getting to all three tiers reliably requires building a data layer that the spend platform never provides out of the box.
How to Build a Spend Analytics Data Stack That Actually Works
If you are exploring how to build this properly for your team, explore how Fintel Analytics approaches spend and finance data engineering — we have built this stack for growth-stage companies across fintech, payments, and e-commerce, and the architecture below reflects what we have learned from delivering it in production.
The architecture has four layers:
Layer 1: Centralised Ingestion
All spend data sources — your card platform (Ramp, Brex, Pleo, Soldo, or similar), accounts payable system, bank feeds, and any ERP or accounting system — need to land in a single data warehouse. For most companies at Series A to Series B scale, BigQuery or AWS Redshift is the right destination. The ingestion method depends on the source: most modern spend platforms expose a webhook or API; legacy systems may require a scheduled CSV pull via an ELT tool like Fivetran or Airbyte.
The critical discipline at this layer is: land raw data as-is, with a clear ingestion timestamp. Never transform in transit. You will thank yourself later when you need to debug why a transaction appeared in two different monthly reports.
Layer 2: Normalisation and Enrichment in dbt
This is where most of the analytical value is created — and where most teams skip straight to dashboards and pay for it later.
In your dbt models, you need to solve five normalisation problems that raw spend data always presents:
- Merchant name normalisation — map raw card network merchant names to a canonical supplier reference. "AWS", "AMZN MKTP", and "Amazon Web Services" all resolve to one supplier ID.
- Category taxonomy — apply a consistent, finance-defined spend category hierarchy (not the platform's default MCCs) that maps to your chart of accounts.
- Cost centre enrichment — join cardholder metadata to your HR system or headcount model so that every transaction inherits a validated cost centre, with a fallback rule for uncoded transactions rather than a null that breaks every downstream report.
- Currency normalisation — convert all foreign currency transactions to your reporting currency using the correct exchange rate methodology — monthly average, not transaction spot rate, for P&L reporting. If this is a particularly complex problem for your business, our post on FX Exposure Analytics for Fintech covers the underlying data architecture in more detail.
- Budget integration — your budget model (typically built in Excel or a planning tool) needs to be ingested as a structured dbt seed or staging model so that actuals and budget live in the same semantic layer. Without this join, budget vs actual is always a manual exercise.
Migrating these transformations from spreadsheets into dbt models eliminates a recurring class of manual errors that finance teams typically absorb as "just the way it is". In our experience, this step alone typically cuts the monthly finance close prep time by 30 minutes or more — and more importantly, it makes the numbers trustworthy.
Layer 3: Semantic Layer and Metrics Definitions
Once your spend data is clean, normalised, and enriched, you need a semantic layer that defines your key metrics once — and only once. Total spend by cost centre, variance to budget, run-rate by supplier category, uncategorised transaction rate — these definitions should live in SQL, not in a dashboard tool where they can be defined differently by different people.
We build these using dbt metrics or a dedicated semantic layer tool depending on the client's BI stack. The result is that when a finance manager opens the spend dashboard and a CFO opens the board pack, they are looking at numbers derived from identical logic. That sounds obvious. In practice, it is rare.
Layer 4: Reporting and Alerting
With a clean semantic layer in place, the BI layer becomes straightforward. We typically deliver spend dashboards in Holistics BI or Looker for clients at this scale — both connect directly to BigQuery and support the kind of flexible, self-serve filtering that finance teams need (by cost centre, by supplier, by card holder, by entity, by time period).
Equally important is automated alerting. A well-configured spend analytics stack should proactively surface anomalies: a department tracking more than 15% over budget mid-month, a supplier invoice arriving that is more than 20% above the prior month baseline, or a cardholder with more than five uncategorised transactions. These alerts turn spend data from a backward-looking report into a real-time control mechanism.
We rebuilt exactly this kind of alerting system for a Series A fintech — giving their treasury and finance team real-time visibility into spend anomalies for the first time. The result was measurable: funding misses and surprise budget overruns dropped significantly in the quarters after deployment, and leadership had a quantifiable measure of spend efficiency they could present at board level.

What Does It Cost to Ignore This Problem?
The business case for fixing spend analytics is rarely framed correctly. Most finance teams think about it as "we need better reporting." The right frame is: what is this costing us right now?
Cost 1: Finance team time. A weekly executive spend report that requires manual spreadsheet work — pulling CSVs, reconciling supplier names, correcting cost centre codes, applying exchange rates — typically consumes two to four hours of a senior finance team member's time per week. At Series B scale with a head of finance earning a market salary, that is meaningful money for a task that should run automatically.
Cost 2: Decisions made on wrong numbers. A misallocated cost centre is not just an accounting error. If your product team appears to be running 30% under budget because their cloud spend is being coded to a shared IT cost centre, your board is seeing a fundamentally misleading picture of where the company is spending money. We have seen capital allocation decisions made on spend data this unreliable.
Cost 3: Audit and compliance risk. For companies approaching Series B or preparing for institutional due diligence, spend data that cannot be cleanly traced from transaction to GL code to board report is a material risk. Investors and auditors ask these questions. Having the answer ready matters.
Cost 4: Duplicate spend. Supplier rationalisation — identifying where multiple teams are buying the same tool, subscribing to the same service, or purchasing from the same supplier on different contracts — is only possible if your spend data is clean and searchable. Industry data suggests this type of duplicate or redundant spend is common across fast-growing companies, yet it often goes undetected for quarters simply because the data is too fragmented to analyse.
For context on market scale: the expense management software market was valued at approximately USD 8.3 billion in 2025 and is projected to reach USD 9.1 billion in 2026, growing at a sustained double-digit CAGR through the early 2030s. That growth reflects the scale of investment companies are making in spend control — yet most of that investment goes into the capture layer, not the analytics layer that makes the data useful.
The Five Warning Signs Your Spend Analytics Is Failing
Based on our experience working with growth-stage companies, these are the signals that tell us a company's spend data infrastructure needs urgent attention:
1. Your finance team builds the spend pack in Google Sheets. If the source of truth for board-level spend reporting is a manually assembled spreadsheet, you have a data reliability problem disguised as a process problem.
2. Finance and operations disagree on the same number. If the finance team's view of marketing spend and the marketing team's view of marketing spend do not match — and the difference requires an email chain to resolve rather than a shared dashboard — you have a single source of truth problem.
3. You cannot answer "how much did we spend with supplier X last year" in under 60 seconds. This is the most basic supplier analytics question, and it should be answerable instantly from a BI tool. If it requires a CSV export and a vlookup, your spend data is not analytically ready.
4. Budget vs actual requires manual work to produce. Your budget and your actuals should live in the same data model, with variance calculated automatically. If producing a budget vs actual requires any manual step, that step will eventually introduce an error.
5. Uncategorised transactions accumulate without anyone noticing. If your spend platform has no automated chase or escalation for uncoded transactions, and nobody is monitoring the uncategorised rate in a dashboard, your spend category data is quietly degrading every week.
If three or more of these apply to your organisation, the spend analytics problem is costing you more than the fix would.
Frequently Asked Questions
Q: What is spend analytics for finance teams?
A: Spend analytics for finance teams is the practice of centralising, cleaning, and modelling company spend data — from corporate cards, AP systems, and bank feeds — into a reliable reporting layer that supports budget vs actual tracking, supplier analysis, cost centre reporting, and board-level financial visibility. It goes beyond what spend management platforms provide out of the box by adding normalisation, enrichment, and a governed semantic layer.
Q: Why can't we just use the reports built into our spend management platform?
A: Off-the-shelf spend platform reports are designed to answer operational questions about individual transactions and approval status. They typically lack budget integration, canonical supplier hierarchies, validated cost centre mapping, and the flexibility to join spend data with other business data (headcount, revenue, entity structure). For board-level or cross-functional analysis, you need a data layer that sits underneath the platform.
Q: How long does it take to build a proper spend analytics stack?
A: For a growth-stage company with one primary spend platform and a single accounting system, a well-scoped spend analytics build — ingestion, dbt normalisation models, semantic layer, and an initial dashboard — typically takes four to eight weeks depending on data complexity and the number of integrations required. The biggest variable is usually the quality and consistency of the historical spend data.
Q: Do we need a data warehouse to do spend analytics properly?
A: For companies with more than around 30 employees and multiple spend data sources, yes — a cloud data warehouse (BigQuery or Redshift are the most common choices at this scale) is the right foundation. Without it, you are building analytical logic on top of platform exports, which breaks every time the export format changes and makes it impossible to join spend data with other business data.
Q: What is the ROI of fixing spend analytics?
A: The ROI comes from three sources: time saved (eliminating manual monthly reporting work), decisions improved (accurate budget vs actual prevents misallocation), and spend identified and rationalised (duplicate supplier consolidation, subscription overlap). In practice, for a Series A company, the combined value typically exceeds the cost of the build within two to three quarters.
If your finance team is still assembling spend reports manually, fielding questions about numbers that don't match, or operating without real-time visibility into where the company's money is going — that is a solvable problem, and the solution is not another spend management tool. At Fintel Analytics, we have helped growth-stage fintech, payments, and e-commerce businesses build spend analytics stacks from the ground up — from initial data audit and source integration through to production dbt models, semantic layers, and live finance dashboards. The businesses that fix this problem stop firefighting at month-end and start making faster, more confident decisions with their capital.