What Is Net Revenue Management Analytics?
Net revenue management analytics is the discipline of using data to maximise the revenue and margin a business retains after discounts, trade spend, rebates, and promotional investment are deducted from gross sales. Rather than focusing purely on top-line revenue, it gives commercial teams a granular, data-driven view of where margin is actually being created or destroyed — across channels, customers, product mixes, and promotional events.
For many businesses, the gap between gross revenue and net revenue is enormous — and largely invisible. Consumer goods manufacturers, food and beverage companies, pharmaceutical distributors, and multi-channel retailers routinely discover that between 15% and 30% of gross revenue disappears into discounts, allowances, and promotional funding before a single penny reaches the P&L. Without robust analytics infrastructure to track and explain that waterfall, commercial decisions are being made on dangerously incomplete information.
This post explains how net revenue management (NRM) analytics works in practice, what data architecture it requires, and the specific outcomes businesses achieve when they build this capability properly.
Why Do Businesses Struggle to See Their True Net Revenue?
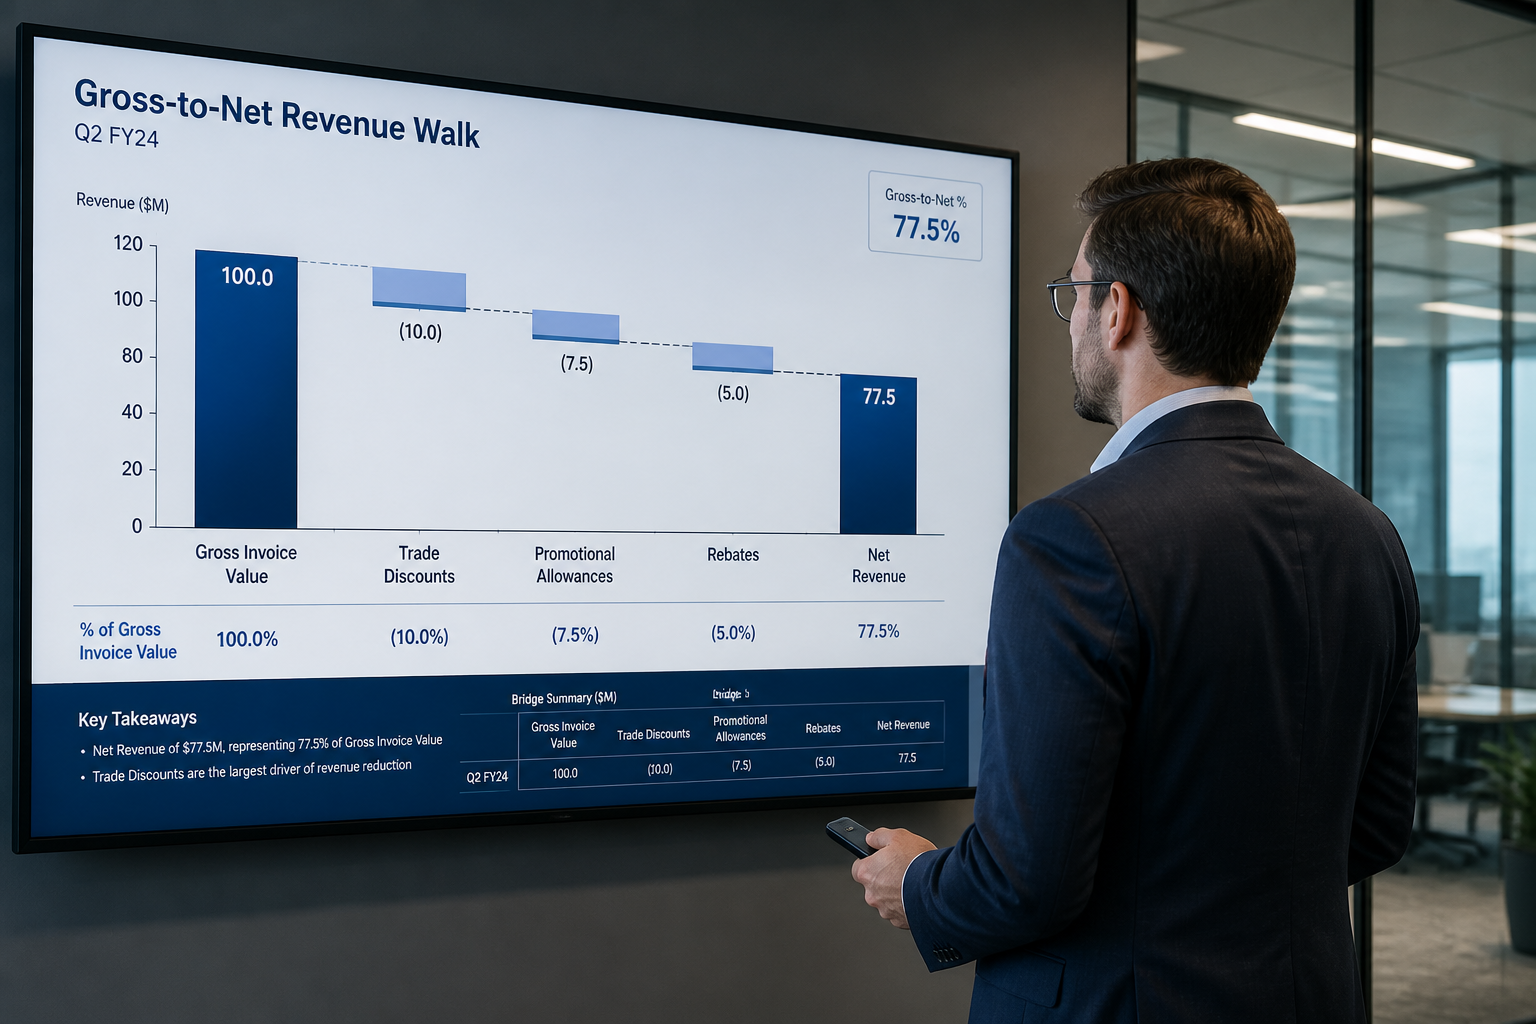
The core problem is structural. Gross-to-net deductions — the rebates, promotional allowances, volume discounts, off-invoice deals, and customer funding arrangements that sit between gross invoice value and net realised revenue — are typically recorded across multiple disconnected systems. ERP platforms capture some trade terms. CRM tools hold promotional agreements. Finance systems record accruals. Retailer portals contain redemption data. None of these speak to each other by default.
The result is what practitioners in this space call the "gross-to-net waterfall problem": no single source of truth exists to show commercial leaders exactly how much was spent on a given customer, promotion, or SKU — and whether it was worth it.
A common pattern we see when working with consumer goods and retail clients is that trade spend data is reconciled weeks or months after the promotional event, often in spreadsheets that cannot be easily interrogated or cross-referenced against volume and margin outcomes. Decisions about the next promotion are made before the last one has been properly evaluated.
According to industry analysis from McKinsey, companies that invest in structured revenue growth management capabilities — including analytics infrastructure — typically achieve gross margin improvements of between two and four percentage points over a two-to-three-year period. For a business turning over £500 million, that is a material difference in profitability, not a rounding error.
The challenge is not a commercial strategy problem. It is a data problem. Businesses need a connected, governed data layer that brings gross revenue, deductions, promotional activity, volume, and mix data together in a form that commercial analysts can actually use.
What Does a Net Revenue Management Analytics Architecture Look Like?
Building a robust NRM analytics capability requires more than a good dashboard. It requires a deliberate data engineering foundation that connects the right sources, applies consistent business logic, and surfaces insight at the right granularity.
Here is the architecture pattern Fintel Analytics recommends and implements for clients approaching this problem:
1. Unified gross-to-net data model All revenue deduction types — on-invoice discounts, off-invoice rebates, promotional accruals, volume allowances, settlement discounts — are mapped to a standardised schema. Every deduction line is tagged by customer, channel, SKU, promotion event, and time period. This is the foundation everything else depends on.
2. Promotional event tracking layer Each promotional activity is treated as a discrete, measurable event with a start date, end date, mechanic type, funding amount, volume uplift target, and actual outcome. This allows post-event evaluation to happen automatically rather than manually.
3. Price pack architecture (PPA) analytics module This component models the profitability of each SKU-channel-customer combination at the net revenue level, enabling teams to identify which pack sizes, formats, or channel configurations are contributing positively to margin and which are being subsidised by trade investment.
4. Mix analytics engine Mix shift — changes in the proportion of high-margin versus low-margin products, channels, or customers within the revenue base — is one of the most underappreciated drivers of P&L performance. A well-designed mix analytics engine decomposes revenue and margin variance into price, volume, and mix components, so leadership teams understand exactly what is driving performance.
5. BI reporting and commercial decision layer The output is a commercial analytics environment — typically built in a modern BI platform such as Power BI, Looker, or Tableau — where trade marketing, sales, and finance teams can interrogate performance, model scenarios, and evaluate the ROI of trade investment in near real time.
If you are looking to build this kind of capability in your organisation, explore how Fintel Analytics approaches commercial data architecture — we work with businesses globally to design and deliver exactly this kind of integrated solution, from data modelling through to front-end analytics.
How Does Promotional Effectiveness Analytics Actually Work?
Promotional effectiveness is typically the highest-value starting point within a broader NRM analytics programme. For many consumer goods businesses, trade promotion spend represents the second or third largest cost line in the P&L — yet studies suggest that a significant proportion of promotions fail to break even when the full cost of trade investment is accounted for.
A rigorous promotional effectiveness model needs to answer four questions for every promotional event:
- Incremental volume: How much additional volume was generated that would not have occurred without the promotion? (This requires a credible baseline model, typically built using time series forecasting techniques.)
- Cannibalisation and forward buying: Did the volume uplift come at the expense of adjacent SKUs or future periods? Cannibalisation within a portfolio and pantry-loading by consumers can both make a promotion look better than it is in the short term.
- Net revenue per unit: After all trade funding, discounting, and logistics costs associated with the promotion are deducted, what was the net revenue per unit compared to the non-promoted baseline?
- ROI and payback: Given the investment made, did the promotion generate a positive return? And if so, how does it compare to other promotional mechanics or channels?
In our work with FMCG clients, we regularly find that when this kind of granular measurement is put in place for the first time, the distribution of promotional ROI is highly skewed — a relatively small number of promotions drive the majority of value, while a long tail of activity delivers neutral or negative returns. Redirecting even a portion of trade spend from the negative tail to high-performing mechanics typically unlocks meaningful margin improvement without any reduction in overall commercial activity.
This connects closely to the broader discipline of pricing analytics, where the interaction between base price, promoted price, and trade investment needs to be modelled together to understand true price realisation.

Which Industries Benefit Most From NRM Analytics?
While net revenue management originated in consumer packaged goods, the analytical principles apply wherever businesses face complex trade terms, multi-tier channel structures, or high promotional investment. In 2026, the following sectors are seeing the strongest adoption:
Consumer goods and FMCG The original home of NRM. Businesses here are moving from annual trade planning spreadsheets to dynamic, event-level analytics that allow in-flight optimisation of promotional programmes. Global manufacturers are increasingly requiring their regional commercial teams to demonstrate ROI on trade spend as a condition of budget allocation.
Food service and beverages Distributor rebates, outlet-level promotional funding, and on-premise activation costs create a complex gross-to-net structure that is difficult to manage without dedicated analytics infrastructure. Businesses in this space are building NRM capabilities to understand profitability at the outlet and channel level rather than just the aggregate.
Pharmaceutical and medical devices Gross-to-net deductions in pharma — including payer rebates, chargebacks, and government pricing adjustments — can represent a substantial fraction of gross revenue. Analytics-driven gross-to-net management is increasingly a regulatory and financial reporting requirement as well as a commercial optimisation tool.
Retail and e-commerce Retailers managing private label margins alongside branded supplier funding arrangements are applying NRM analytics to understand the true cost and profitability of promotional activity at the category level. For multi-channel retailers, understanding net margin by fulfilment channel is particularly valuable given the cost differential between in-store and last-mile delivery.
Distribution and wholesale Complex rebate structures, volume tier pricing, and early payment discounts create significant gross-to-net complexity for distributors. Analytics that connect purchase terms, sales pricing, and rebate accruals at the SKU-customer level enables much more precise profitability management.
For businesses in distribution specifically, this overlaps with the kind of commercial intelligence discussed in our guide to prescriptive analytics for business — where the goal is not just to measure what happened, but to generate actionable recommendations for what to do next.
What Outcomes Can Businesses Expect From NRM Analytics?
The outcomes are well-documented across industries where this capability has been built properly. Based on available client and industry data:
- Trade spend efficiency: Organisations that implement systematic promotional ROI measurement typically reallocate 10–20% of trade spend toward higher-returning activities within the first 12 months, without increasing total investment.
- Gross margin improvement: McKinsey and other strategy sources have consistently found that structured revenue growth management programmes — of which NRM analytics is a core enabler — can deliver two to four percentage points of gross margin improvement over a multi-year horizon.
- Reduction in manual reconciliation time: Replacing spreadsheet-based gross-to-net tracking with an automated data pipeline typically reduces finance team time on deduction reconciliation by 60–80%, freeing commercial analysts to focus on insight generation rather than data assembly.
- Faster promotional decision cycles: With near-real-time event tracking, commercial teams move from quarterly post-mortems to in-flight optimisation — identifying underperforming promotions weeks earlier and adjusting activation or investment accordingly.
- Improved forecasting accuracy: When the promotional uplift model is integrated into demand forecasting, businesses see material improvements in forecast accuracy at the SKU level, which in turn reduces the cost of overstock and stockout across the supply chain.
These are not theoretical outcomes. They reflect the pattern of value realisation we observe when businesses make the transition from fragmented, spreadsheet-based commercial reporting to a connected, governed NRM analytics infrastructure.
Frequently Asked Questions
Q: What is net revenue management analytics?
A: Net revenue management analytics is the use of data and analytical models to understand, optimise, and report on the revenue and margin a business retains after all trade deductions, discounts, rebates, and promotional spend are accounted for. It gives commercial teams a granular view of where value is created or destroyed across customers, channels, products, and promotional events.
Q: How is net revenue management different from gross revenue reporting?
A: Gross revenue measures the total invoiced value before any deductions. Net revenue management analytics goes further by modelling the full gross-to-net waterfall — all the discounts, allowances, and trade investment that reduce what the business actually realises. Without this, commercial teams are managing performance on an incomplete and potentially misleading P&L view.
Q: What data sources are needed for NRM analytics?
A: A comprehensive NRM analytics solution typically draws on ERP or order management data (for invoice-level revenue and on-invoice discounts), trade promotion management systems (for planned and accrued off-invoice spend), financial systems (for rebate settlements and accruals), point-of-sale or sell-out data (for volume and promotional uplift measurement), and product master data (for SKU-level margin attribution).
Q: How long does it take to build a net revenue management analytics capability?
A: A minimum viable NRM analytics layer — covering gross-to-net data modelling, promotional event tracking, and a core BI reporting environment — can typically be delivered in 10 to 16 weeks depending on data maturity and source system complexity. A full capability including mix analytics, scenario modelling, and integrated forecasting is more typically a six-to-twelve-month programme.
Q: Which teams benefit most from NRM analytics?
A: Commercial finance, trade marketing, national accounts, and revenue management teams are the primary users. However, supply chain planning benefits significantly from the improved demand signal that comes from integrated promotional uplift modelling, and senior leadership gains a far more accurate view of true business performance.
For many businesses, the gap between gross revenue and net margin is the single largest unmanaged lever in the P&L — not because the data does not exist, but because it has never been properly connected, modelled, or put in the hands of the people making commercial decisions. At Fintel Analytics, we have helped consumer goods, retail, and distribution businesses build NRM analytics capabilities from the ground up — designing the data architecture, building the gross-to-net models, and delivering the commercial reporting environments that give teams the confidence to make faster, better-informed decisions. If your commercial team is still reconciling trade spend in spreadsheets and evaluating promotions months after they have run, that is a solvable problem — and the margin improvement it unlocks typically makes it one of the highest-return data investments a business can make.