 Fintel Analytics
Interchange Fee Analytics: Stop Flying Blind on Card Costs
Most fintech and payments businesses are losing basis points on every transaction without knowing it. Here is how to build interchange fee analytics that actually show you where the money is going.
Interchange fee analytics for fintech means building a data layer that lets you monitor, attribute, and optimise the fees flowing through your card transactions — broken down by card type, MCC, geography, and pricing model. Without it, you are managing one of your largest cost lines from a blended summary report that tells you almost nothing.
If you run a card-issuing programme, operate as an acquirer, or process significant card volume as a merchant or platform, interchange is not a fixed cost you just absorb. It is a variable, rules-driven structure with hundreds of rate categories — and the difference between a well-governed data stack and a poorly governed one can easily be tens of basis points per transaction. At scale, that is a material number. The problem is that most growth-stage companies do not find out until they are large enough that it finally hurts.
Why Blended Interchange Reporting Leaves You Flying Blind
The first thing to understand about interchange is how fee structures actually work. Fees are separated into interchange, scheme, and processor/gateway components. The total rates include a fixed transaction fee and a margin specified on the acquiring side, with interchange and scheme fees being pass-through — and therefore variable depending on card types and processing characteristics.
The problem most fintech finance teams face is that they only ever see the aggregate. Their PSP or acquirer sends a monthly settlement file, and someone — usually in finance, often in a spreadsheet — reconciles total fees against total volume to produce a blended effective rate. That number might look stable quarter on quarter. But underneath it, the composition of your transaction mix is shifting in ways that directly affect your cost structure.
Interchange rates vary based on card type (credit, debit, rewards, commercial), transaction type (card-present vs. card-not-present), merchant category, and region — with domestic transactions often cheaper than cross-border ones due to lower fraud risk. A blended rate hides all of this. When your proportion of cross-border, corporate, or rewards card transactions increases — which it does naturally as you grow — your blended rate drifts upward without any single transaction looking wrong.
A pattern we see repeatedly in our work with early-stage payments companies: the finance team reports a slight increase in processing costs, the CTO points to volume growth, and nobody investigates the actual fee mix. Months later, a board-level cost review reveals that 40% of transaction volume has migrated to a higher-cost card category — and the drift has been happening for two quarters.

📺 Watch: Building in Fintech 📉 in 2025 - 5 Data Pitfalls 🤬 to Avoid

What Interchange Fee Analytics Actually Looks Like
Building real interchange visibility means moving from summary-level settlement data to transaction-level fee attribution. Here is what that data stack needs to produce:
1. Transaction-level fee decomposition
Every transaction should carry its own fee breakdown: interchange component, scheme fee component, acquirer markup. Merchants do not pay interchange fees directly — they are embedded within the Merchant Discount Rate charged by their PSP or acquiring bank. The MDR includes three components: the interchange fee paid to the issuing bank, the card scheme fee charged by the network, and the acquirer markup charged by the PSP or acquiring bank. Your analytics layer needs to reconstruct this split from transaction-level data, even when your settlement file only gives you MDR.
2. Interchange qualification rate tracking
This is the metric most companies are not tracking — and it is arguably the most important. Interchange fees are not just set by card type; they depend on whether a transaction qualifies for a particular rate category based on data completeness, authorisation timing, and clearing quality. Each interchange rate has a series of requirements that must all be satisfied for a transaction to qualify for that rate. Requirements include factors such as merchant category, the time between authorisation and clearing, and the submission of enhanced transaction data.
If you are not monitoring qualification rates — what percentage of eligible transactions are landing in their optimal rate category versus falling into downgrades — you are leaving money on the table and you do not know it.
3. Card mix segmentation
Rates vary by card type, transaction method, and geography — for example, consumer versus corporate cards. Your analytics model should produce a daily breakdown of transaction volume and fee cost by card product category. When corporate card volume spikes, your team should see it before it hits the P&L.
4. Scheme fee attribution
Scheme fees — charged by card networks like Visa and Mastercard to cover infrastructure, transaction processing, fraud, authentication and risk tools — are often the least-visible component of the MDR stack. They vary by transaction type, geography, and programme configuration. Building them into your attribution model is the step that separates a mature payments analytics stack from a basic settlement reconciliation.
If you are looking to build this kind of transaction-level fee intelligence into your data stack, explore how Fintel Analytics approaches payments data engineering — we design and deliver exactly this for fintech and payments businesses globally.
The Interchange++ Pricing Model and Why It Changes Everything
One of the most consequential decisions a growth-stage fintech can make is whether to operate on a blended pricing model or an interchange++ structure — and then to build the analytics infrastructure that makes the chosen model legible.
Interchange++ provides a detailed breakdown of the three payment card costs: the acquirer markup, the card scheme fee, and the interchange fee. Under blended pricing, you pay a single rate regardless of what the underlying fee structure actually was. You are charged the same markup on every transaction, and you cannot see the cost split. While a fixed fee may seem easy to understand, it is not transparent.
For early-stage companies with modest volume, blended rates are often operationally simpler. But as transaction volumes grow, the case for interchange++ becomes compelling — it is often more cost-effective than blended rates, especially for high-volume businesses, with potential savings of greater than 1% per transaction when optimised.
The catch is that interchange++ is only valuable if you have the analytics infrastructure to understand what you are actually paying at the transaction level. Without it, you are on interchange++ pricing but still reading blended summaries — getting none of the visibility and all of the operational complexity.
We have seen this exact scenario with a Series A payments platform that had negotiated interchange++ with their acquirer but was still reconciling from aggregate settlement files in Google Sheets. Their finance director genuinely did not know what rate category the majority of their transactions were landing in. When we rebuilt their data pipeline — pulling raw transaction data into BigQuery, modelling fee decomposition in dbt, and surfacing the output in a live dashboard — they discovered that approximately 28% of eligible transactions were downgrading due to authorisation-to-clearing timing issues. The fix was a processing configuration change that had been available for months; the cost had just been invisible.
Visa CEDP and the New Data Quality Imperative
The regulatory and scheme context for interchange analytics has also shifted materially. In October 2025, Visa rolled out its new Product 3 interchange rate changes and data quality enforcement (CEDP), bringing Visa closer to fully retiring its existing Level 2 programme by April 2026. Visa's CEDP merges the previous Level 2 and Level 3 incentive structures for small business and commercial cardholders into a single programme.
Merchants currently qualifying for Level 2 and Level 3 rates should see Product 3 rates that are 15 basis points lower than existing levels — partially offset by a 5-basis point network participation fee, resulting in net savings of 10 basis points per eligible transaction.
But here is the critical operational point: even small errors in address, tax amount, or line-item details can prevent transactions from qualifying for the reduced rate. The savings are real — but only if your data quality is sufficient to pass scheme validation. Several merchants have experienced higher interchange costs on transactions that were previously qualifying for Level 2 or Level 3 rates, even merchants that are fully supporting CEDP.
This is exactly the kind of problem that a proper interchange analytics stack surfaces early. If your qualification rate drops the week after a scheme change, you want an alert — not a discovery six weeks later when the settlement summary finally tells you your costs went up.
How to Build the Interchange Analytics Data Stack
Here is the architecture that works in practice for a growth-stage fintech. This is not theoretical; it is the pattern we deploy.
Layer 1 — Raw ingestion
Pull raw transaction data from your acquirer, PSP, or scheme reporting API into your data warehouse (BigQuery or AWS Redshift are the most common at this stage). The key point is that you need transaction-level data, not settlement summaries. Most acquirers and PSPs offer this via API or SFTP file delivery — scheme portals like Visa Analytics Platform also provide transaction-level reporting that can be ingested directly.
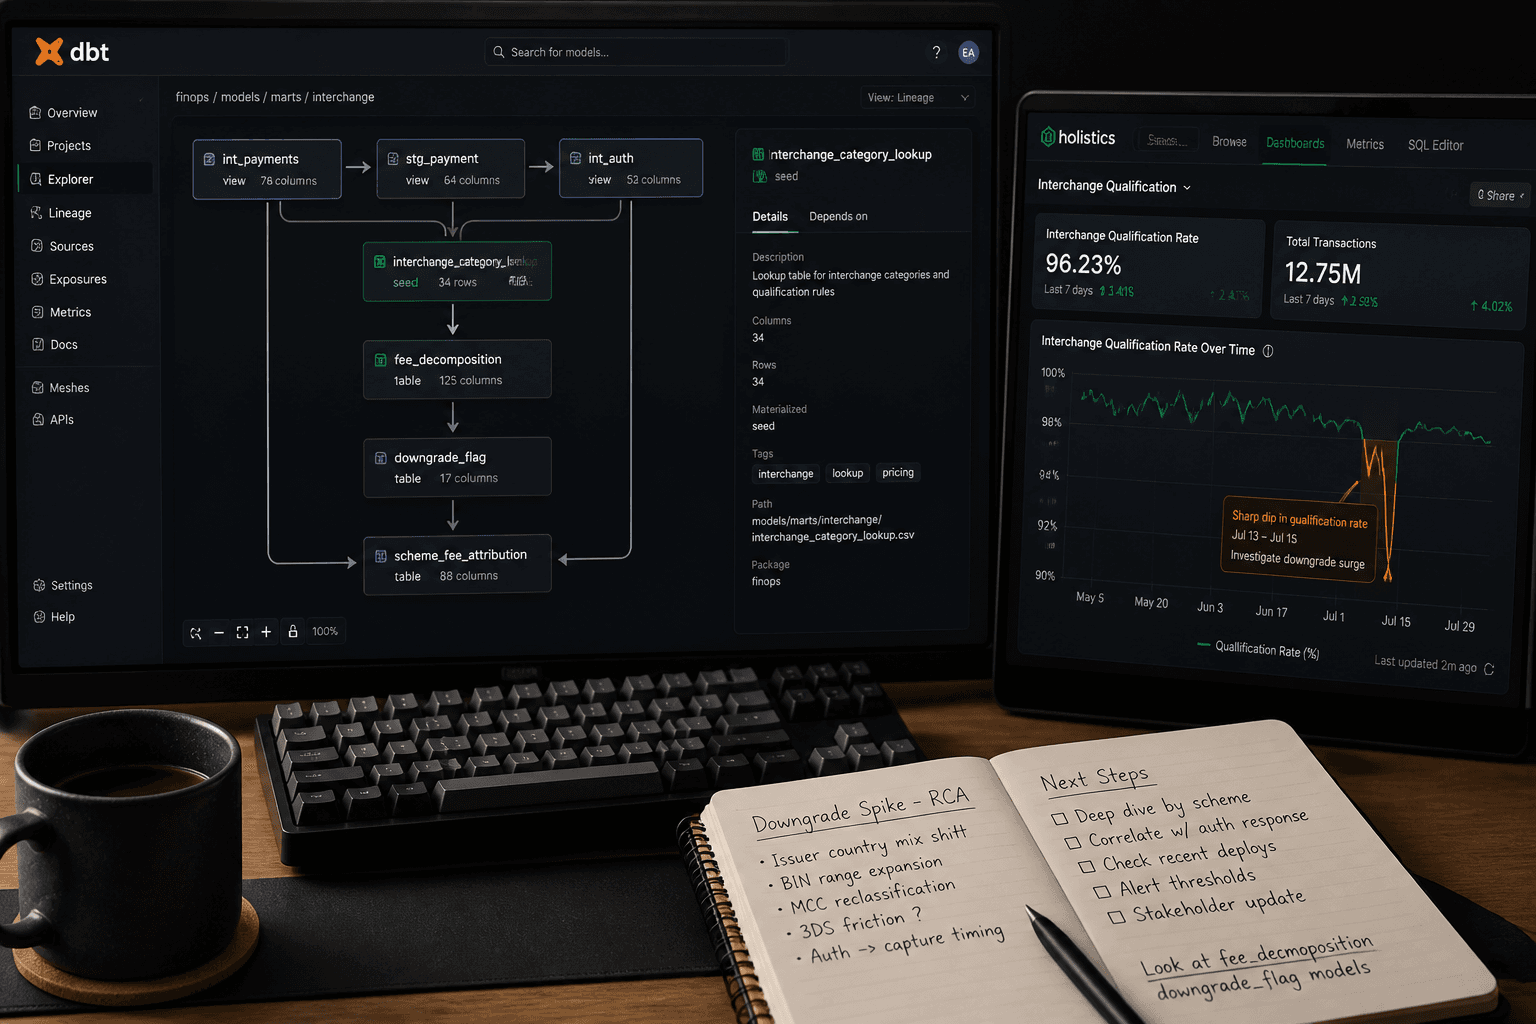
Layer 2 — dbt models for fee attribution
Build a set of dbt models that:
- Normalise transaction records across acquirers and PSPs to a consistent schema
- Apply interchange rate lookup tables (maintained as dbt seeds or reference tables, updated when schemes publish rate changes in April and October each year)
- Calculate expected interchange category per transaction based on card type, MCC, processing method, and geography
- Flag transactions where the actual settled rate differs from the expected optimal rate (these are your downgrades)
- Attribute scheme fees separately from interchange
This model layer is where most of the analytical value is created. The dbt code is version-controlled, testable, and auditable — which matters when finance and engineering need to agree on the numbers.
Layer 3 — BI layer and alerting
Surface the models in your BI tool of choice — we typically deliver this in Holistics or Looker for payments clients. The dashboards that actually drive action are:
- Daily qualification rate by card type and corridor
- Effective interchange rate trend versus prior periods
- Downgrade volume and estimated cost impact
- Scheme fee breakdown by product type
- Card mix composition over time
Pair the dashboards with automated alerting: if your qualification rate on a specific card category drops more than two percentage points day-over-day, someone should know within hours — not at month-end.
For context on how this connects to broader payment stack visibility, our post on PSP data analytics covers the upstream data architecture that feeds this kind of interchange intelligence.
What Good Interchange Analytics Actually Delivers
The outputs from a well-built interchange analytics stack are not just cost-saving — they feed directly into commercial and product decisions:
Cost attribution by product or merchant segment: If you are a platform or marketplace, you can now attribute interchange costs to specific merchant categories or product lines — and price your product accordingly. This is the foundation of rational interchange pass-through pricing.
Interchange revenue tracking for issuers: If you issue cards, interchange is revenue, not a cost. Interchange revenue is a way for businesses to earn a share of fees made from card transactions using cards they issue. With embedded finance, companies can build tailored, global card programmes that offer physical or virtual cards that let users receive and spend funds almost instantly. Tracking that revenue at the transaction level — by card product, geography, and spend category — is how you model the true economics of your card programme. For a deeper dive on the issuing-side data stack, see our guide to card programme analytics.
Negotiation leverage with acquirers and PSPs: When you walk into a pricing renegotiation with a breakdown of your actual card mix, qualification rates, and downgrade costs, you are in a fundamentally different position than a company presenting only total volume. Acquirers respond to specificity.
Scheme change impact modelling: Visa sets fees every April and October. With a proper interchange analytics model, you can load the upcoming rate tables and run a simulation against your historical transaction mix to estimate the P&L impact before the change goes live. Without that model, you find out after the fact.
Frequently Asked Questions
Q: What is interchange fee analytics and why does it matter for fintech?
A: Interchange fee analytics is the practice of monitoring, attributing, and optimising the fee components embedded in card transaction costs — specifically interchange, scheme fees, and acquirer markup — at the transaction level. For fintech and payments businesses, it matters because interchange is one of the largest variable cost lines in the business, and it is invisible by default when you only report at the blended rate level.
Q: How do I know if my transactions are qualifying for the right interchange rate?
A: You need transaction-level data from your acquirer or PSP, combined with a model that maps each transaction to its expected interchange category based on card type, MCC, processing method, and geography. Transactions that settle at a higher rate than expected are downgrades — and tracking your downgrade rate over time is the core metric of interchange qualification analytics.
Q: What is the difference between a blended rate and interchange++ pricing?
A: A blended rate charges you a single fixed markup regardless of what the actual underlying interchange rate was for each transaction. Interchange++ passes through the actual interchange and scheme fees and adds only the acquirer's markup on top. Interchange++ gives you more visibility and often lower costs at scale — but only if you have the analytics infrastructure to read the transaction-level data it produces.
Q: How does Visa CEDP affect interchange costs in 2026?
A: Visa's Commercial Enhanced Data Programme (CEDP), rolled out in October 2025, merged Level 2 and Level 3 data requirements into a single Product 3 structure. Merchants qualifying under the new programme can access rates approximately 10 basis points lower than before on eligible transactions — but only if their transaction data meets Visa's enhanced validation requirements. Companies without analytics monitoring in place risk losing qualification without knowing it.
Q: What data do I need to build an interchange fee analytics stack?
A: At minimum, you need transaction-level settlement data from your acquirer or PSP (not just summary files), access to scheme rate tables, and a data warehouse to model the fee attribution. In practice, we build this on BigQuery with dbt for the transformation layer — pulling in raw transaction data, modelling interchange category lookups, flagging downgrades, and surfacing the output in a BI dashboard with automated alerting.
Interchange fee analytics is one of those areas where the gap between companies that have built the data infrastructure and those that have not is measured directly in basis points — every single day, on every card transaction they process. At Fintel Analytics, we have helped fintech issuers, acquirers, and payment platforms build exactly this kind of transaction-level cost intelligence — from raw PSP data ingestion through to automated downgrade alerting in production. If your team is managing interchange costs from a blended settlement summary, you are not managing them at all, and we can change that quickly.