 Fintel Analytics
Fintech Ledger Analytics: Fix Broken Balance Intelligence in 2026
Most fintechs have a ledger. Very few have analytics built on top of it. This guide shows exactly what breaks, and how to fix it.
Fintech ledger analytics is the practice of building structured data pipelines, monitoring, and reporting on top of your financial ledger — so that balance integrity, position accuracy, and transaction consistency become observable, alertable, and reportable in real time. Most fintechs have a ledger. Very few have meaningful analytics built on top of it. That gap is where the most damaging and most invisible financial data problems live.
If you are a CTO or head of finance at a growth-stage fintech, you have probably experienced some version of this: the ledger says one number, the bank says another, and nobody in the room can tell you why with confidence. The reconciliation takes hours. The investigation takes longer. And somewhere upstream, a balance has been drifting unchecked for weeks.
This post is not about how to build a ledger. It is about what to build on top of one — specifically, the analytics layer that gives your finance, operations, and leadership teams genuine visibility into the financial positions your product is generating every day.
Why Do Fintech Balance Problems Go Undetected for So Long?
The answer is almost always the same: the ledger is transactional infrastructure, and nobody has built an analytics layer over it.
A database table is not a ledger — and even when a real ledger is in place, the cracks show eventually: a user balance is off by a few cents, an edge case triggers a double withdrawal, a refund fails silently and leaves a ghost debit in the system. These are not ledger failures. They are observability failures — the system had no mechanism to surface the anomaly before it compounded.
Most fintechs start tracking money in Excel, graduate to repurposing their general ledger, then eventually face a reckoning when reconciliation breaks, auditors ask questions, or a regulatory filing deadline looms. By the time that reckoning arrives, the data problems are structural.
Many fintechs focus on creating a frictionless front-end experience for customers, often overlooking the complex systems required to support it. The back office — particularly financial reconciliation and settlement — is usually treated as an afterthought. This approach creates significant risks, including financial errors, regulatory non-compliance, and operational bottlenecks that inhibit growth.
A pattern we see repeatedly in our work with early-stage fintech clients: the engineering team has built a solid double-entry ledger at the product layer — debits and credits balanced atomically, idempotency keys in place, the fundamentals done right. But ask them to answer any of these questions and the room goes quiet:
- What is our total float position across all provider accounts right now?
- Which user cohort has the highest average outstanding balance this week?
- Are there any accounts where the sum of credits minus debits does not equal the recorded balance?
- How has our average settlement lag changed since we onboarded our second PSP?
None of these questions require rebuilding the ledger. They require an analytics layer built over it.

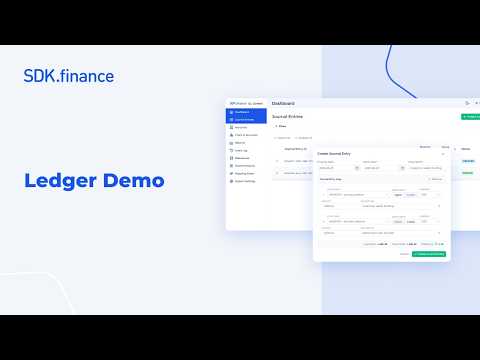
📺 Watch: SDK.finance General Ledger Demo | Double-Entry Ledger for Fintechs
What Does a Fintech Ledger Analytics Stack Actually Look Like?
The architecture is simpler than most teams expect. The complexity is not in the tooling — it is in the modelling decisions.
Step 1: Raw ledger ingestion into the warehouse
The starting point is replicating your ledger tables — journal entries, account balances, transaction records — into BigQuery or your cloud warehouse of choice. Tools like Fivetran, Airbyte, or custom CDC pipelines handle this. The goal is a faithful, append-only replica of your ledger data that your analytics layer can query without touching production.
One thing to establish immediately: your analytics ledger replica should be treated as read-only infrastructure. No transformations should happen at ingestion. You want raw fidelity first, then you model on top.
Step 2: dbt models for ledger positions and balance integrity
This is where the real work begins. In dbt, you build a hierarchy of models:
- Staging models: Clean and type-cast raw journal entries. Enforce schema contracts — amount must be numeric, currency must be a valid ISO code, account ID must not be null.
- Intermediate models: Reconstruct running balances per account by summing debits and credits chronologically. This is your computed balance — the one you will compare against the recorded balance.
- Mart models: Aggregate positions by account type, provider, currency, and time period. These are the tables your dashboards and alerts query.
The critical dbt test that most teams skip: a balance integrity assertion at the account level. For every account, the sum of all journal entry amounts should equal the stored balance. If it does not, you have ledger drift — and you want to know about it immediately, not at month-end.
-- Example dbt test logic (plain SQL)
SELECT
    account_id,
    SUM(entry_amount) AS computed_balance,
    MAX(recorded_balance) AS stored_balance,
    ABS(SUM(entry_amount) - MAX(recorded_balance)) AS drift_amount
FROM journal_entries
GROUP BY account_id
HAVING ABS(SUM(entry_amount) - MAX(recorded_balance)) > 0.01
This is not a sophisticated model. But the number of growth-stage fintechs running without it would surprise you.
Step 3: Alerting on ledger anomalies
Positional drift, missing entries, currency mismatches, and duplicate posting are not dashboard problems — they are alerting problems. You need automated checks that fire when the data breaks, not when someone happens to look at a chart.
In practice this means scheduling dbt tests on a short cadence — hourly at minimum for ledger integrity tests — and routing failures to a dedicated Slack channel or PagerDuty alert that your finance ops team actually monitors. The specific anomalies worth alerting on:
- Any account where computed balance deviates from recorded balance by more than a defined threshold
- Journal entries posted with a future value date (common sign of a timing bug)
- Net positions by currency that move outside defined operational bounds
- Any provider account that has not received an entry in a window where activity was expected
A well-designed ledger system is not just about keeping score. It is the source of truth for balances, transactions, and reconciliation. It powers regulatory compliance, user trust, financial reporting, and operational transparency. The analytics layer you build on top of it is what makes all of those things verifiable — not just asserted.
What Does Ledger Drift Actually Cost?
This is the question finance teams struggle to answer because they do not have the data to quantify it until someone builds the analytics layer that surfaces it.
In our work with fintech clients, we have seen ledger drift range from a nuisance to an existential risk — and the difference is usually how early it was caught.
A capital reconciliation project we delivered for a global payments company uncovered a $25M discrepancy that had gone undetected across multiple ledger accounts. At market borrowing rates, that gap was costing over $6,000 per day in implicit financing cost — not because the money was stolen or misappropriated, but because the position was unknown and therefore unmanaged.
In the 2021 through 2024 period, reconciliation-related complaints represented between 12.95% and 15.64% of all fintech payment complaints annually — roughly one in seven. The companies generating those complaints were not failing at payments. They were failing at visibility into what their payments infrastructure was producing.
The Synapse collapse in 2024 made this viscerally real. Gaps in ledgering contributed to millions of dollars in unreconciled customer funds — a cautionary tale that accelerated demand for purpose-built ledger infrastructure.
The operational cost compounds too. A reconciliation process that took 30–50 minutes to run for a client was rebuilt as an automated SQL pipeline — it now completes in under 3 seconds. That is not just a time saving. It is the difference between a finance team that can investigate anomalies in real time and one that is always catching up.
If you are looking to build this kind of capability into your fintech's data infrastructure, explore how Fintel Analytics approaches this — we work with growth-stage fintech and payments businesses globally to design and deliver exactly this kind of analytics engineering.
How Do You Build Position Analytics Across Multiple Currencies and Providers?
This is where ledger analytics gets meaningfully harder — and where most off-the-shelf approaches fall short.
Growth-stage fintechs typically operate across multiple banking partners, PSPs, and currencies simultaneously. Your ledger may be internally consistent, but your analytical view of positions needs to aggregate across all of those sources in a way that is both accurate and fast.
The modelling approach we use in delivery:
Currency normalisation at the mart layer, not the staging layer. Staging models should preserve original currency values. FX conversion to a base reporting currency happens in mart models, using a daily rates table sourced from a reliable FX feed. This means you can always reconstruct the original position in native currency if an FX rate is queried or disputed.
Provider accounts as first-class entities. Rather than aggregating everything into a single "cash" position, model each provider account separately and roll up to a consolidated position. This gives your treasury team visibility into which provider is holding what, and flags concentration risk when one provider account grows disproportionately.
Point-in-time balance reconstruction. One of the most useful — and most underbuilt — capabilities in ledger analytics is the ability to answer "what was our total float position at 14:00 on 15 March?" with confidence. This requires an event-sourced model where you can replay journal entries up to any point in time. In dbt, this is implemented using a valid_from / valid_to pattern on your balance mart, or using BigQuery's RANGE window functions to compute running positions at arbitrary timestamps.
For a deeper look at how these position analytics interact with intraday funding decisions, our post on Intraday Liquidity Analytics for Fintech covers the treasury layer in detail.
Modern ledger systems typically support multiple currencies by maintaining separate balances per currency. They can also handle FX-related flows by recording conversions as balanced entries across currency accounts. Your analytics layer needs to reflect this structure — not flatten it.

What Should Your Ledger Analytics Dashboard Actually Show?
Most fintech BI implementations make the same mistake: they build dashboards for the CFO quarterly review rather than for the finance ops team who are working from them every day.
Ledger analytics dashboards should answer operational questions first. Here is the view hierarchy we recommend:
1. Balance integrity scorecard (updated hourly) A simple traffic-light view: how many accounts have computed balance equal to recorded balance? If it is not 100%, which accounts are drifting and by how much? This is the first thing the finance ops team should check each morning.
2. Float position by provider and currency (updated every 15–30 minutes) Total cash held at each provider, in each currency, versus expected position based on settled transactions. Variance from expected triggers an alert, not just a dashboard update.
3. Transaction volume and value by account type (daily) How much money moved through each account type today versus the same day last week? Sharp deviations in either direction are operational signals — not just finance reporting.
4. Aged unreconciled items (daily) Any journal entry that has not been matched to an external record within your defined SLA window. Sorted by age and value — the oldest and largest items at the top.
5. Position trend over rolling 30/60/90 days Not for operations — for leadership. Where is our float growing? Which currencies are concentrating? This is the view that informs treasury decisions and provider negotiations.
Weekly executive reporting that required 90 minutes of manual work for one fintech client was replaced entirely by a live dashboard on this structure — zero manual effort, updated hourly. The finance team went from spending Monday morning building reports to spending it acting on them.
In 2026, trust and speed are the most emphasised priorities for data teams, even as cost pressures remain present. The share of respondents who say increasing trust in data and data teams is important rose from 66% in 2025 to 83% in 2026. In ledger analytics specifically, trust is not a nice-to-have — it is the entire point. A balance number that finance does not trust is worthless, however fast the dashboard loads.
How Does This Connect to Regulatory and Audit Requirements?
This is the question that usually accelerates the conversation from "nice to have" to "we need to build this now."
Refunds and reversals are recorded as new transactions that offset earlier ones — this preserves the full history of financial events and keeps audit trails intact. Your analytics layer should expose this history, not obscure it. Every transformation applied to ledger data in your warehouse should be reproducible, documented, and versioned — which is exactly what dbt's lineage and documentation capabilities are designed to support.
In practical terms, this means:
- Auditors can request a point-in-time balance for any account on any date — and you can produce it in minutes from your warehouse, with the query that generated it.
- Regulatory submissions that rely on position data can be generated automatically from the same mart models that power your operational dashboards — eliminating the manual extraction step that introduces errors.
- Any disputed transaction can be traced from the dashboard cell, back through the dbt model, to the raw journal entry in the staging table, and ultimately to the source ledger record. Full lineage, no gaps.
Double-entry logic enforces balance integrity — if one side of a transaction is missing or malformed, the system will not reconcile. Every transaction can be broken down into its component parts, making investigations and audits far simpler. Your analytics layer should make this same guarantee at the reporting level: if the numbers in your dashboard do not reconcile to your ledger, the pipeline should fail loudly — not silently produce a wrong number.
For fintechs navigating the intersection of ledger data and FX positions, our post on FX Exposure Analytics for Fintech covers how to model currency risk across a multi-provider ledger structure.
Frequently Asked Questions
Q: What is fintech ledger analytics?
A: Fintech ledger analytics is the practice of building data pipelines, monitoring, and business intelligence directly over your financial ledger data. It enables finance and operations teams to track balance integrity, detect ledger drift, monitor float positions by provider and currency, and produce regulatory-grade audit trails — all in near real time, without manual extraction.
Q: How is ledger analytics different from payments reconciliation?
A: Reconciliation is the process of matching internal records to external sources (bank statements, PSP reports). Ledger analytics sits one layer deeper — it monitors the internal ledger itself for integrity, drift, and positional accuracy, before external matching even begins. The two are complementary: you cannot reconcile reliably if your internal ledger analytics are not clean.
Q: What data infrastructure do I need to build ledger analytics?
A: At minimum: a cloud data warehouse (BigQuery or equivalent), a transformation layer (dbt is the standard choice), and a BI tool connected to your mart models. You also need a reliable CDC or batch replication process to get ledger data from your operational database into the warehouse. Most growth-stage fintechs can stand this up in four to eight weeks with the right expertise.
Q: How often should ledger integrity checks run?
A: For balance integrity assertions — at least hourly. For position monitoring dashboards — every 15 to 30 minutes. For aged unreconciled item tracking — daily, with alerts for anything breaching your defined SLA window. The frequency should reflect how quickly a ledger anomaly can compound into a material financial impact in your specific product.
Q: What are the most common signs that a fintech needs ledger analytics?
A: Finance and engineering giving different balance numbers when asked the same question. Reconciliation processes that take hours rather than seconds. Inability to answer "what was our total float position at this time yesterday?" with confidence. Month-end closes that require significant manual investigation. Any of these is a signal that the ledger is being trusted but not verified.
If your fintech is making financial decisions based on balances that have never been independently verified by an analytics layer, you are carrying more risk than you know — and the longer that goes unaddressed, the harder and more expensive the fix becomes. At Fintel Analytics, we have helped payments companies, neobanks, and embedded finance platforms build exactly this kind of ledger intelligence — from initial data audit and warehouse design through to production dbt models, automated integrity checks, and operational dashboards the finance team actually relies on. If your balance data is a black box today, that is a solvable problem — and solving it is usually faster than you expect.