Embedded Analytics for SaaS Products: The Build vs. Buy Decision in 2026
Embedded analytics for SaaS products means integrating interactive dashboards and data exploration capabilities directly into your application — so your customers never have to leave your product to understand their own data. Done right, it turns a workflow tool into a decision-making platform. Done wrong, it becomes a six-month engineering distraction that still ships a clunky iframe nobody uses.
The market pressure to get this right is real and growing. The global embedded analytics market was valued at USD 27.09 billion in 2026 and is projected to reach approximately USD 100.98 billion by 2035, expanding at a CAGR of 15.74%. More than 69% of independent software vendors are now embedding analytics into their platforms to provide built-in intelligence, resulting in better end-user retention and improved SaaS differentiation. If your competitors are already shipping analytics inside their products and you are not, that gap is visible to every prospect doing a feature comparison.
But the build vs. buy question is where most product and engineering teams get stuck — and where the wrong call costs the most. This post gives you the framework we use when clients come to us facing exactly that decision.
Why Embedded Analytics Has Become a Product-Critical Feature
A few years ago, embedded analytics was a nice-to-have — a premium tier feature you bolted on after the core product was stable. In 2026, that calculus has shifted. 81% of analytics users now prefer embedded tools over standalone BI platforms, which means customers increasingly expect to interrogate their data inside the product they are already paying for, not inside a separate tool they have to learn.
Embedded analytics transforms a SaaS product from a workflow tool into a decision-making platform. The business impact is measurable across three dimensions: adoption, support load, and competitive differentiation.
On adoption: product-led SaaS companies that embed analytics report up to 3x increases in analytics feature usage within the first two months of deployment, because removing the friction of switching to a separate tool makes data accessible.
On support: when customers can self-serve their own data questions, support requests drop — teams report 30–40% reductions in data-related support tickets after embedding analytics.
On competitive differentiation: in a crowded SaaS market, a well-executed analytics layer becomes a retention moat. Customers who are actively using your dashboards to run their operations are not churning. The data becomes sticky before the product does.
A pattern we see repeatedly in our work with early-stage SaaS companies: the decision to embed analytics gets made reactively — a large customer asks for it during a sales call, or a competitor ships it first. That reactive pressure leads to rushed architectural choices that scale poorly. The companies that get this right treat embedded analytics as a product decision, not an engineering task.

📺 Watch: How to Embed Analytics in Your SaaS Product in Under a Day With Toucan
The Build vs. Buy Framework: What Actually Determines the Right Answer
The instinct for many CTOs at Series A or B is to build. You control the UX, you own the data model, and you do not have a vendor dependency sitting in the middle of your customer experience. All of those things are true — but they are not free.
Maintaining custom-built embedded analytics at scale costs $2–3M per year in engineering salaries and infrastructure. That is before you account for the opportunity cost: every sprint your engineering team spends rebuilding chart rendering, query optimisation, and row-level security is a sprint not spent on your core product. Product teams that need customer-facing analytics face a common dilemma: building in-house gives full control over the UI and data model, but consumes engineering resources that could go toward core product features — while buying an embedded BI tool is faster to ship, but can feel rigid and disconnected from the product experience.
Here is the framework we use with clients to cut through the noise:
Build when:
- Your analytics use case is genuinely bespoke — custom real-time streaming visualisations, proprietary ML outputs that need specialised rendering, or deeply domain-specific chart types that no platform supports.
- Analytics is your core product, not a supporting feature. If you are building a BI tool, build it.
- You have a data engineering team of 5+ who can own the analytics layer as a dedicated product.
Buy (or use a hybrid platform) when:
- Engineering time is better spent on core functionality, and you need to ship embedded analytics within weeks, not quarters.
- You expect the number of embedded dashboards and customer segments to grow — multi-tenancy at scale is extraordinarily hard to build correctly.
- You need self-service capabilities for end users — filter controls, date range pickers, drill-downs — that an off-the-shelf platform gives you on day one.
There is also a third path worth naming: code-first embedded platforms. Some platforms — notably Holistics — offer a middle ground: visual dashboard building for speed, combined with Git-based version control, CI/CD workflows — giving product teams the deployment speed of a buy decision with the maintainability of a build decision. This is the architecture we recommend most often for growth-stage SaaS companies who need to move fast without painting themselves into a corner.
If you are working through this decision right now and want a second opinion on the architecture, explore how Fintel Analytics approaches embedded analytics implementation — we work with SaaS businesses globally to design and deliver exactly this kind of solution, from data model through to production deployment.
The Architecture Decisions That Determine Whether This Scales
Once you have resolved the build vs. buy question, the architecture work begins — and this is where most implementations go wrong. The three decisions that matter most are multi-tenancy, the semantic layer, and row-level security.
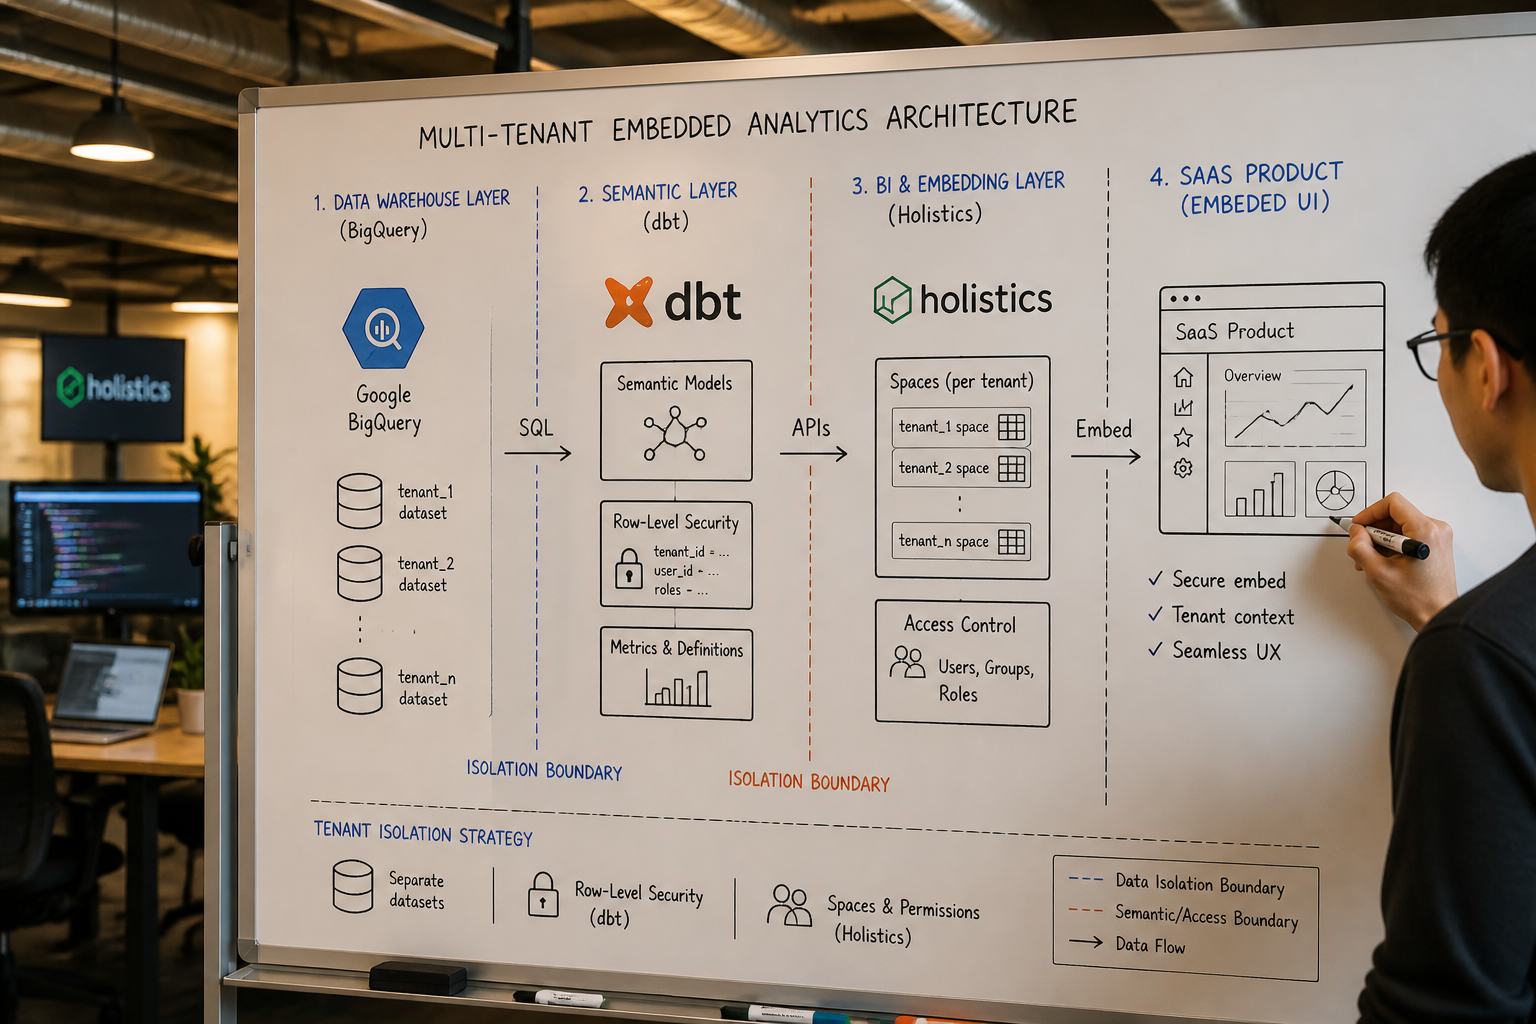
Multi-Tenancy: Per-Tenant Isolation Without Per-Tenant Deployments
If your product serves multiple customers, every embedded dashboard must show each customer only their own data. The naive implementation is to create separate database schemas or separate report configurations per customer. That works until you have 50 customers, then 200, then it becomes operationally unmanageable.
The correct approach is dynamic row-level security applied at the query layer. When evaluating embedded analytics platforms, multi-tenancy is a critical capability: the platform must support per-tenant data isolation at the query level, with dynamic row-level security ensuring each customer sees only their own data without requiring separate deployments per tenant.
In practice, this means your analytics platform must accept a user or tenant identifier at authentication time and filter every query accordingly — automatically, without manual configuration per customer. Platforms that require you to manage this manually at the dashboard level will fail at scale.
The Semantic Layer: Where Most SaaS Implementations Break
A pattern we see repeatedly: the first version of an embedded analytics feature ships with raw SQL queries baked directly into the visualisation layer. It works in demo. It breaks in production. Revenue is calculated differently between dashboards. Customer A's "active users" metric does not match Customer A's own definition. Support tickets start arriving about data discrepancies, and your credibility with that account is damaged.
The fix is a semantic layer — a governed, centralised definition of every metric your customers will see. In our stack, this is typically built in dbt (data build tool), with Holistics BI consuming those models and exposing them as a consistent, browsable metric catalogue to both your product and your end users.
This architecture means that when a metric definition changes — say, how you calculate monthly active users — it changes in one place, propagates everywhere, and every customer dashboard updates automatically. Without this, you are manually patching SQL across dozens of dashboards every time the business logic evolves.
White-Labelling: The UX Bar Is Higher Than You Think
White-labelling and UI customisation are non-negotiable: embedded dashboards should match your product's design — logos, colours, fonts, layout — and the analytics experience should feel like a native part of your application, not a third-party widget. This sounds obvious, but it is consistently underestimated. We have seen embedded analytics roll-outs stall in customer review because the chart styling clashed with the host product's design system. The moment a customer notices they are looking at a different product inside your product, the trust signal breaks.
The Hidden Cost of Getting Embedded Analytics Wrong
The cost of a poor embedded analytics implementation shows up in three places, and only the first one appears in the engineering budget.
Engineering debt: When the first version is built on bare SQL and iframes with no semantic layer and no query governance, the ongoing maintenance cost is punishing. Every new customer with a slightly different data shape requires bespoke configuration. Every metric change requires a multi-dashboard patching exercise. In our experience, teams that built this way typically spend 30–40% of their analytics engineering time on maintenance rather than new capability.
Customer trust: Data products that show inconsistent numbers — different totals in the summary view versus the detail drill-down, metrics that do not match the customer's own source systems — erode account relationships faster than almost any other product failure. In financial services and fintech especially, a single unexplained discrepancy can trigger a review meeting with the customer's CFO. We have seen this directly: a capital reconciliation project we delivered for a fintech client uncovered a $25M discrepancy that had gone undetected in their existing reporting — at market borrowing rates, that gap was costing over $6,000 per day. The numbers your customers see in your embedded dashboards carry real accountability.
Velocity loss: The teams that build embedded analytics on a weak foundation find themselves unable to ship new analytics features at the pace their product roadmap demands. Each new chart type or metric requires a disproportionate amount of engineering effort because the underlying architecture cannot absorb change cleanly. This is the compounding cost that finance teams never see — but product teams feel every sprint.
Over 61% of enterprises face integration issues due to data silos, legacy systems, and technical limitations when implementing embedded analytics — a figure that reflects how often the underlying data architecture is not ready for customer-facing use before the product team commits to shipping it.
For SaaS companies with recurring revenue models, the relationship between embedded analytics quality and churn is also worth understanding. If you are thinking about the downstream retention impact of analytics features, our post on Subscription Analytics: Reduce Churn & Grow MRR in 2026 covers the metrics and models that matter.
Choosing the Right Embedded Analytics Platform in 2026
The leading embedded analytics platforms in 2026 include Holistics, Looker, Tableau Embedded, Sisense, GoodData, Power BI Embedded, Embeddable, and Luzmo, and they approach the problem very differently. Here is how to cut through the marketing and evaluate them on what actually matters in production.
The questions that surface the real differences:
-
How is multi-tenancy implemented? Is row-level security applied dynamically at query time, or does it require manual configuration per customer? The former scales. The latter does not.
-
Does the platform support a semantic layer or code-based metric definitions? Platforms that force you to define metrics at the visualisation layer (rather than in a governed data model) will create consistency problems at scale.
-
What does white-labelling actually mean? Can you override fonts, colours, and component styling to match your design system? Or are you constrained to their default theme? Ask to see a customer reference who has done a full white-label implementation.
-
How is the platform priced at scale? Embedded analytics pricing models vary enormously. Per-user pricing that seems reasonable at 100 customers becomes painful at 10,000. Capacity-based pricing is often more predictable for SaaS at scale — but requires careful resource planning.
-
What is the performance story at query time? Customer-facing dashboards that take 8 seconds to load will not be used. Ask vendors for p95 query latency benchmarks under realistic multi-tenant load, not just their best-case demos.
For SaaS businesses on a BigQuery or dbt stack — which describes most of our growth-stage clients — Holistics BI stands out as a particularly strong fit. It is code-first (AML-based modelling language with Git integration), natively supports multi-tenant data access control, and is built to sit on top of your existing warehouse rather than requiring data duplication. As an official Holistics BI partner, we have delivered this architecture across fintech, payments, and e-commerce clients — and it consistently ships faster and stays more maintainable than alternatives that abstract the SQL layer away entirely.
Frequently Asked Questions
Q: What is embedded analytics for SaaS products?
A: Embedded analytics for SaaS products means integrating interactive dashboards, reports, and data exploration tools directly into your application — so your customers can analyse their own data without leaving your platform. It typically involves a combination of a BI or analytics platform, a semantic layer for metric governance, and row-level security for multi-tenant data isolation.
Q: How do I decide whether to build or buy embedded analytics?
A: Buy (or use a code-first hybrid platform) if analytics is a supporting feature rather than your core product, if you need to ship in weeks rather than quarters, or if your customer count will scale significantly. Build only if your analytics requirements are genuinely bespoke — highly specialised visualisations, real-time streaming, or deeply domain-specific outputs that no existing platform supports. The maintenance cost of a custom build at scale frequently exceeds $2M per year in engineering resources.
Q: What is multi-tenant embedded analytics and why does it matter?
A: Multi-tenant embedded analytics means a single analytics deployment serves multiple customers, with each customer seeing only their own data. It matters because the alternative — separate deployments or manual data filtering per customer — is operationally unscalable beyond a small number of accounts. The correct architecture applies dynamic row-level security at the query layer, so tenant isolation is automatic regardless of how many customers you add.
Q: What role does a semantic layer play in embedded analytics?
A: A semantic layer is a governed, centralised repository of metric definitions — where "monthly active users" or "net revenue" means the same thing across every dashboard your customers see. Without it, metrics drift: different dashboards calculate the same figure differently, customer trust erodes, and every metric change requires a manual patching exercise across your entire dashboard library. Tools like dbt combined with Holistics BI deliver this in a code-first, version-controlled way.
Q: How long does it take to implement embedded analytics in a SaaS product?
A: With the right platform and a clean underlying data model, a first production release of embedded analytics — multi-tenant, white-labelled, with 3–5 core dashboards — typically takes 6–10 weeks. The biggest variable is the state of your upstream data: if your source data requires significant normalisation before it can be exposed to customers, that adds material time. Companies that try to build entirely in-house typically take 3–6 months longer and with substantially higher ongoing maintenance costs.
Embedded analytics for SaaS products is one of those decisions where the technical choices made in the first eight weeks determine whether the feature becomes a product differentiator or a permanent maintenance burden. At Fintel Analytics, we have designed and delivered embedded analytics architectures for fintech, payments, and e-commerce SaaS companies — helping them move from scattered ad-hoc reporting to governed, multi-tenant analytics that their customers actually use every day. If your team is weighing this decision now — build vs. buy, platform selection, or how to structure the underlying data model — that conversation is worth having before the architecture is locked in.