What Is Procurement Analytics — and Why Does It Matter in 2026?
Procurement analytics is the practice of applying data analysis, machine learning, and business intelligence to purchasing activity — spanning spend classification, supplier performance, contract compliance, and risk exposure. Done well, it transforms procurement from a back-office cost centre into a strategic function that directly protects margin and drives competitive advantage.
For most organisations, procurement represents between 50% and 70% of total revenue spent on goods and services. Yet according to research by McKinsey, fewer than 30% of procurement teams use advanced analytics systematically — meaning the majority are still managing billions in spend through spreadsheets, disconnected ERP reports, and gut feel. In 2026, that gap is not just inefficient. It is dangerous.
Supply chain disruption, input cost volatility, ESG compliance pressure, and increasingly complex supplier ecosystems have made reactive procurement a genuine business risk. The organisations pulling ahead are those treating procurement data as a strategic asset — using it to anticipate cost shifts, identify consolidation opportunities, and build resilient supplier relationships before problems emerge.
Why Do Businesses Still Struggle With Procurement Data?
The challenge is rarely a lack of data. Most mid-to-large organisations sit on an abundance of purchasing records, supplier contracts, invoice histories, and ERP transaction logs. The problem is structural fragmentation: procurement data is scattered across finance systems, procurement platforms, supplier portals, and legacy spreadsheets — often in incompatible formats, with inconsistent taxonomy and no single source of truth.
A common pattern we see at Fintel Analytics is organisations attempting to run spend analysis manually every quarter, only to find that by the time the report is produced, the data is already three months stale. Worse, spend categories are inconsistently classified — one division codes "IT services" differently from another — making cross-business benchmarking almost impossible without significant cleansing effort.
The consequences are predictable:
- Maverick spend goes undetected — purchases made outside preferred supplier agreements, eroding negotiated discounts
- Supplier concentration risk is invisible — over-reliance on single suppliers for critical categories only becomes apparent when disruption strikes
- Contract leakage accumulates — suppliers billing above agreed rates, or outside contracted volumes, without triggering automated alerts
- Category managers negotiate blind — without market price benchmarks or historical trend data, buyers lack the leverage to push back effectively
For organisations spending £50M or more annually on procurement, industry estimates suggest that unmanaged spend leakage and missed consolidation opportunities typically cost between 5% and 12% of total addressable spend. At scale, that is a material number.
What Does a Mature Procurement Analytics Capability Look Like?
Building procurement analytics maturity is not a single-step project. It follows a progression that mirrors broader data maturity frameworks, but with procurement-specific priorities at each stage.
Stage 1 — Spend Visibility The foundation is a clean, classified, unified spend cube. This means integrating all procurement data sources into a centralised repository, applying consistent taxonomy (typically aligned to UNSPSC or a custom hierarchy), and producing reliable spend-by-category, spend-by-supplier, and spend-by-business-unit views. Organisations at this stage move from quarterly spreadsheet reports to on-demand dashboards.
Stage 2 — Performance Benchmarking Once spend is visible, the next layer is context: how does your supplier pricing compare to market rates? How does your payment terms performance compare to industry peers? At this stage, organisations integrate external market data — commodity indices, supplier financial health scores, peer benchmarks — alongside internal data to identify negotiation leverage.
Stage 3 — Predictive Intelligence This is where machine learning creates significant lift. Predictive models can flag suppliers showing early financial distress signals (rising days payable outstanding, credit rating downgrades, payment delays to their own suppliers) before those suppliers become a continuity risk. Demand forecasting models, when connected to procurement workflows, allow category managers to time bulk purchases ahead of predicted price increases — a capability that delivered measurable savings for clients in automotive components and industrial consumables categories during the input cost volatility of recent years.
Stage 4 — Prescriptive Optimisation At the most advanced level, prescriptive analytics recommends specific sourcing decisions: which supplier to consolidate volume with, when to re-tender a category, which contracts are approaching renewal with sub-optimal terms. These recommendations are surfaced directly inside procurement workflows — not in a separate BI tool that buyers have to remember to consult.
If you are looking to build this kind of procurement analytics capability in your organisation, explore how Fintel Analytics approaches this — we work with procurement, finance, and operations teams globally to design and deliver data infrastructure and analytics solutions tailored to complex, high-spend environments.
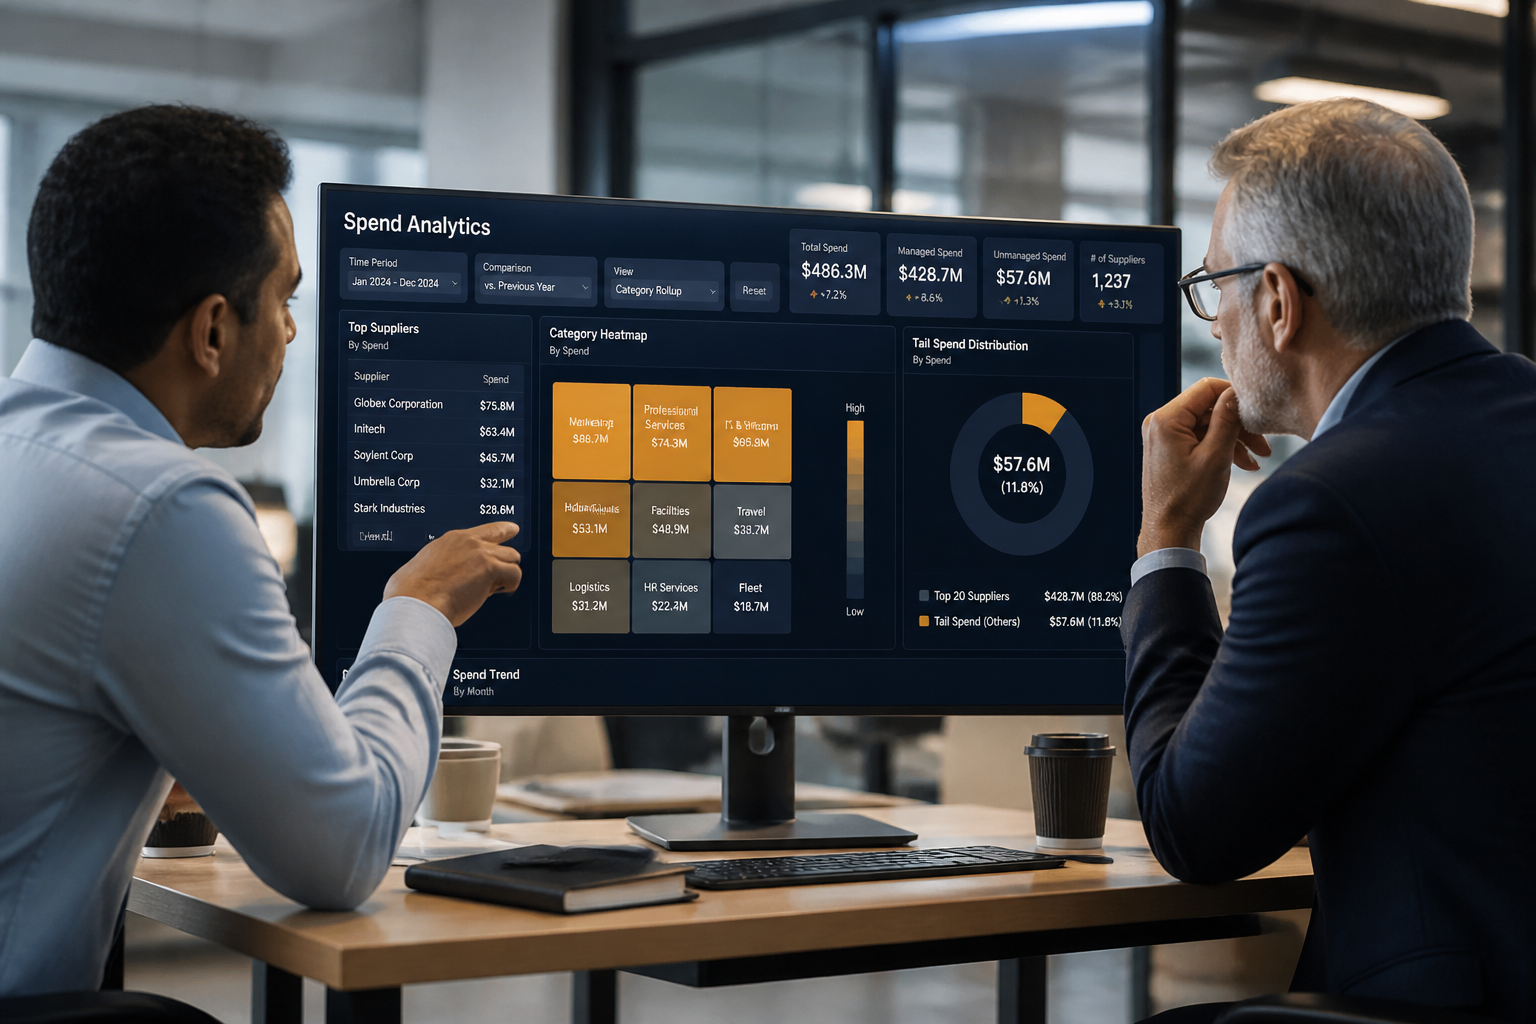
How Does Spend Analytics Identify Real Savings Opportunities?
Spend analytics is the engine of procurement value creation, and the most powerful initial applications are often simpler than organisations expect.
Supplier consolidation analysis is typically the highest-value quick win. By mapping the full supplier base across categories, organisations routinely discover that 60–80% of suppliers account for less than 5% of spend — a classic long-tail problem. Consolidating tail spend to preferred suppliers generates volume discounts, reduces administrative overhead, and simplifies risk monitoring. In our experience working with clients across manufacturing and professional services, a focused tail-spend consolidation programme typically delivers between 8% and 15% savings on the affected spend pool within 12 months.
Duplicate and erroneous payment detection is another immediate win that often surprises finance teams. Machine learning models trained on invoice data can identify duplicate invoices, billing-rate anomalies, and quantity discrepancies that manual three-way matching routinely misses. For organisations processing thousands of invoices monthly, this is not a negligible figure.
Price variance analysis surfaces situations where the same item or service is being purchased at significantly different prices across business units, geographies, or time periods — often because buyers lack visibility into what peers in other parts of the organisation have negotiated. Standardising on best-achieved prices, where contractually possible, can deliver immediate savings without re-tendering.
Category benchmarking uses external market data to assess whether current contract pricing reflects prevailing market conditions. In categories with transparent spot markets — fuel, logistics, packaging materials — this benchmarking is highly precise. In less commoditised categories, supplier financial analysis and peer data provide directional intelligence.
For organisations that have already deployed strong spend analytics, pairing these insights with pricing analytics strategies on the revenue side creates a genuinely integrated margin management capability — optimising both the cost of inputs and the value extracted from outputs.
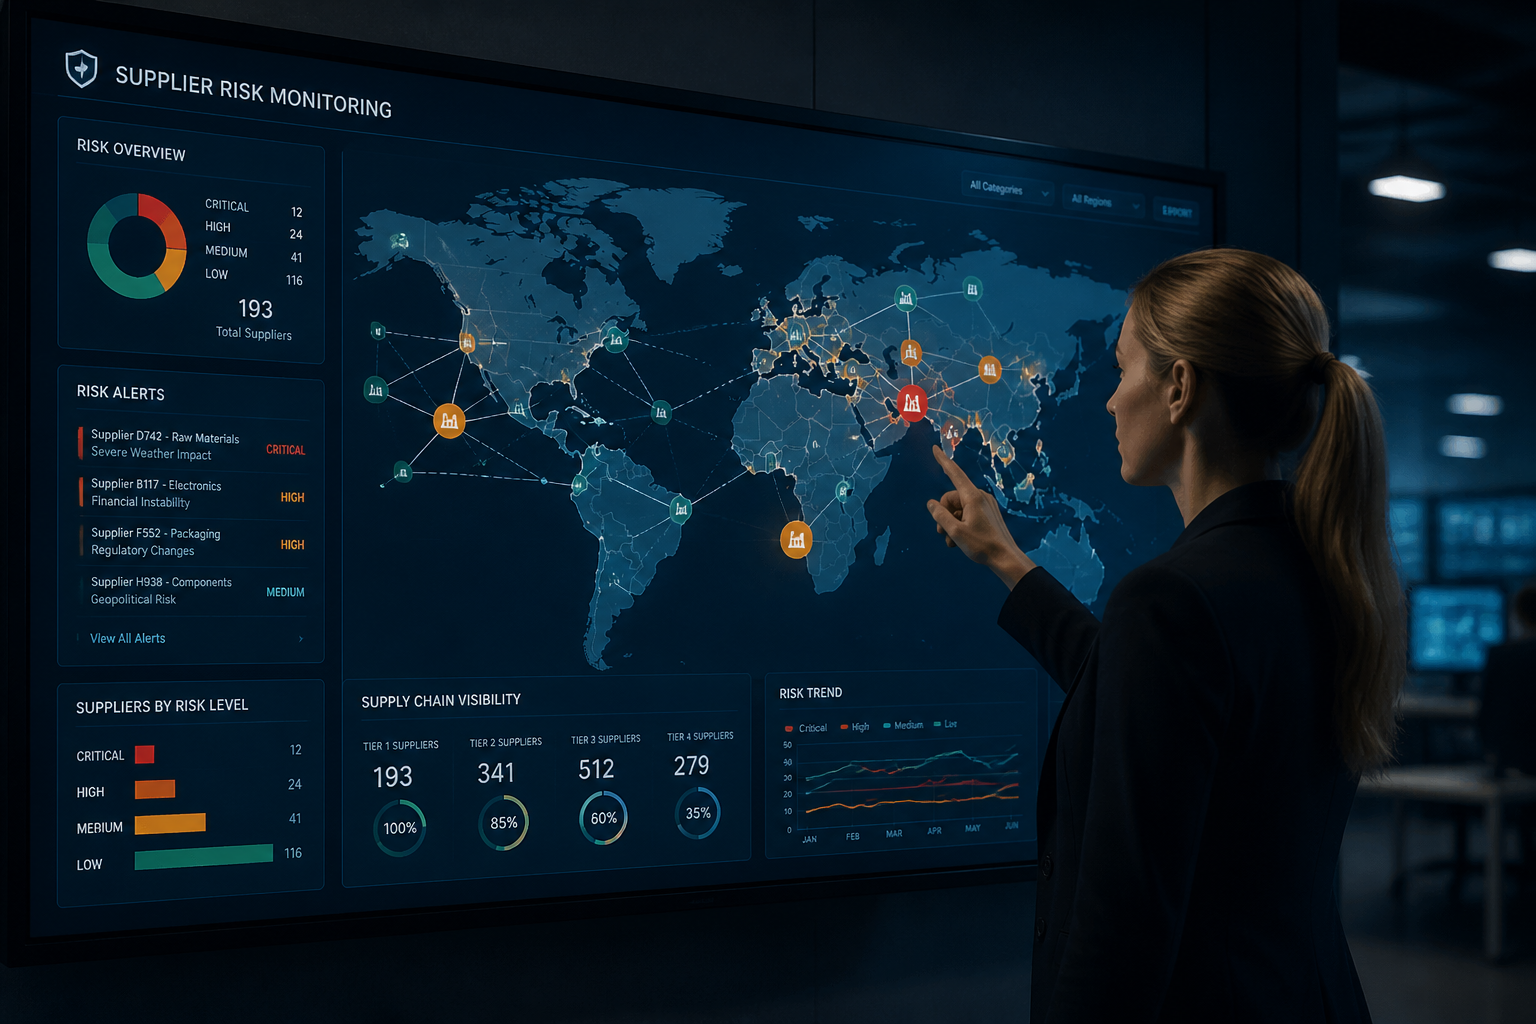
How Can Procurement Analytics Reduce Supplier Risk?
Supplier risk is one of the most underanalysed dimensions of procurement, and one of the most consequential when it materialises. A single critical supplier failure — particularly in a single-source or dual-source category — can halt production, delay delivery, and destroy customer trust in a matter of days.
Modern supplier risk analytics combines multiple data signals into a continuous monitoring system:
- Financial health indicators: credit ratings, payment behaviour, revenue trends, debt levels — sourced from commercial data providers and updated on a rolling basis
- Geopolitical and regulatory exposure: supplier facilities mapped against tariff risk zones, sanctions lists, and regulatory compliance status
- ESG and sustainability scoring: increasingly a contractual and reputational requirement, with data sourced from third-party ESG rating providers and supplier self-assessment platforms
- Operational performance data: on-time delivery rates, quality rejection rates, and incident history drawn from internal procurement and operations systems
- News and event monitoring: natural language processing applied to news feeds and regulatory announcements to surface emerging risks before they appear in structured data
The value of combining these signals — rather than monitoring them in silos — is the ability to generate a composite supplier risk score that updates continuously and triggers alerts when a supplier's profile deteriorates beyond a defined threshold. This shifts procurement from reactive crisis management to proactive risk mitigation.
In practice, this means category managers receive an alert that a Tier 1 supplier in a critical category is showing early financial stress signals, giving the procurement team four to six weeks to qualify an alternative before disruption becomes likely — rather than discovering the problem when deliveries stop.
What Technology Stack Underpins Effective Procurement Analytics?
Building a robust procurement analytics capability requires deliberate data engineering choices, not just a new dashboard on top of an existing ERP.
The typical architecture for a mature procurement analytics platform involves:
- Data integration layer — connecting ERP systems (SAP, Oracle, Microsoft Dynamics), procurement platforms (Coupa, Jaggaer, Ariba), accounts payable systems, and external data feeds through reliable, monitored data pipelines
- Data transformation and taxonomy engine — applying spend classification logic, currency normalisation, entity resolution (matching supplier variants to a canonical supplier record), and data quality rules
- Centralised spend data model — typically hosted in a cloud data warehouse (Snowflake, BigQuery, or Databricks), structured for both operational reporting and analytical modelling
- Analytics and ML layer — predictive models for supplier risk, demand forecasting for strategic categories, and anomaly detection for invoice fraud
- Visualisation and workflow integration — BI dashboards for category managers and finance leadership, with alerts and recommendations surfaced inside existing procurement workflow tools where possible
The critical design principle is that procurement analytics must be embedded in how buyers actually work — not maintained as a separate reporting environment that only specialists consult. Adoption is the bottleneck in most failed implementations, not technology.
This architectural thinking connects naturally to broader questions of prescriptive analytics for business — where the goal is not just insight, but a recommendation that drives a specific action at the point of decision.
Frequently Asked Questions
Q: What is procurement analytics and how does it work?
A: Procurement analytics is the application of data analysis and business intelligence to an organisation's purchasing activity. It works by integrating data from ERP systems, procurement platforms, and external sources into a unified model, then applying classification, benchmarking, and predictive techniques to identify cost savings, supplier risks, and compliance gaps. The output ranges from spend dashboards to ML-powered supplier risk alerts and sourcing recommendations.
Q: How much can procurement analytics save a business?
A: Industry estimates suggest that organisations with mature spend analytics capabilities typically identify savings opportunities equivalent to 5–12% of their total managed spend. The actual realised savings depend on spend volume, category mix, and how well insights are embedded into procurement workflows — but for organisations spending £20M or more annually, the ROI case is typically clear within the first year.
Q: What data do you need to start with procurement analytics?
A: The minimum viable data set is transactional purchasing data — purchase orders, invoices, and supplier master records. Most organisations have this in their ERP, though it requires significant cleansing and classification before it becomes analytically useful. More advanced capability adds contract data, supplier financial data, commodity price feeds, and operational performance records.
Q: How is procurement analytics different from spend analysis?
A: Spend analysis is one component of procurement analytics — focused specifically on understanding what has been spent, with whom, and in which categories. Procurement analytics is broader: it encompasses spend analysis, supplier risk monitoring, contract compliance tracking, demand forecasting, and prescriptive sourcing recommendations. Spend analysis answers "what did we buy?"; procurement analytics answers "what should we do next?"
Q: Can small and mid-sized businesses benefit from procurement analytics?
A: Yes — the entry point has lowered significantly as cloud-based data tools have become more accessible. Organisations spending £5M or more annually on procurement typically find that even basic spend visibility and supplier consolidation analysis generates a meaningful return. The key is starting with focused use cases rather than attempting to build enterprise-scale infrastructure immediately.
Procurement remains one of the highest-leverage functions for data analytics investment — directly connected to margin, resilience, and operational continuity — yet most organisations are still managing it with tools and processes that belong to a previous decade. At Fintel Analytics, we have helped finance, manufacturing, and operations businesses build procurement analytics capabilities from the ground up — from initial data integration and spend classification through to predictive supplier risk models and category management dashboards embedded in live workflows. If your procurement team is still flying blind on spend data, supplier exposure, or contract performance, that is a solvable problem with a measurable payback — and the longer it goes unaddressed, the more it costs.