What Is Churn Analytics — and Why Does It Matter in 2026?
Churn analytics is the practice of using historical customer data, behavioural signals, and predictive modelling to identify customers at risk of leaving — before they do. At its core, it turns reactive retention into a proactive strategy, giving commercial teams time to intervene with precision. In an era where acquiring a new customer costs five to seven times more than retaining an existing one (Harvard Business Review), reducing churn even marginally can have an outsized effect on revenue and long-term growth.
The business case has never been sharper. Across subscription software, financial services, telecoms, and retail, customer expectations are rising and switching costs are falling. A 2026 Bain & Company analysis found that increasing customer retention rates by just five percentage points can increase profits by 25 to 95 percent — a range that reflects how deeply embedded customer lifetime value is in unit economics. Yet many organisations are still reacting to churn after the fact: analysing why customers left rather than building systems to catch them before they go.
This post sets out exactly how churn analytics works, what the best models look like in practice, and how to build an approach that generates measurable retention impact — not just dashboards.
Why Do Businesses Struggle to Predict Customer Churn Accurately?
The most common failure mode we see in our work with clients is not a lack of data — it is a lack of the right data, structured in the right way, feeding models that are actually connected to commercial action.
Here are the four most common reasons churn prediction underperforms:
1. Relying on a single data source. Many organisations build churn models on transactional data alone — purchase frequency, spend, recency. But churn intent often surfaces first in behavioural signals: support ticket volume, login frequency, feature disengagement, NPS score decline. Without these, models are flying partially blind.
2. Treating churn as a binary event. A customer either churned or they did not. This framing ignores the spectrum of disengagement. Customers who downgrade, reduce usage, or stop engaging with communications are sending signals that a binary model will miss entirely.
3. Building models that do not reflect business cycles. A B2B SaaS company with annual contracts faces very different churn dynamics than a D2C subscription box business with monthly billing. Models need to be calibrated to the specific renewal or engagement cadence of the business.
4. Disconnecting model outputs from sales and customer success workflows. A churn score sitting in a data warehouse is not a retention tool. The output needs to be operationalised — routed into CRM systems, flagged in customer success platforms, or triggering automated personalised outreach. Without that integration, the model simply produces a report that nobody acts on.

How Does a Modern Churn Prediction Model Actually Work?
A production-grade churn analytics system in 2026 typically combines several layers of data processing and machine learning. Here is a practical breakdown of the architecture:
Step 1 — Define Churn for Your Business
This sounds obvious but is almost always underspecified. Churn might mean contract non-renewal, account closure, a 90-day period of zero transactions, or a drop below a minimum spend threshold. The definition drives everything downstream — training labels, model evaluation, and what constitutes a successful intervention. Get this wrong and your recall and precision metrics will be technically correct but commercially meaningless.
Step 2 — Engineer Features Across Multiple Signal Types
The strongest churn models combine at least four categories of features:
- Behavioural signals: session frequency, feature adoption depth, mobile vs. desktop usage shifts, time since last meaningful action
- Transactional signals: purchase cadence change, average order value trend, product category migration
- Sentiment signals: support ticket sentiment (using NLP), NPS and CSAT scores, review activity
- Contextual signals: contract tenure, plan tier, pricing sensitivity indicators, competitive events in the customer's sector
For a deeper look at how NLP-derived sentiment signals feed into customer analytics models, see our post on Text Analytics for Business: Unlocking Value from Unstructured Data in 2026.
Step 3 — Choose and Train the Right Model Architecture
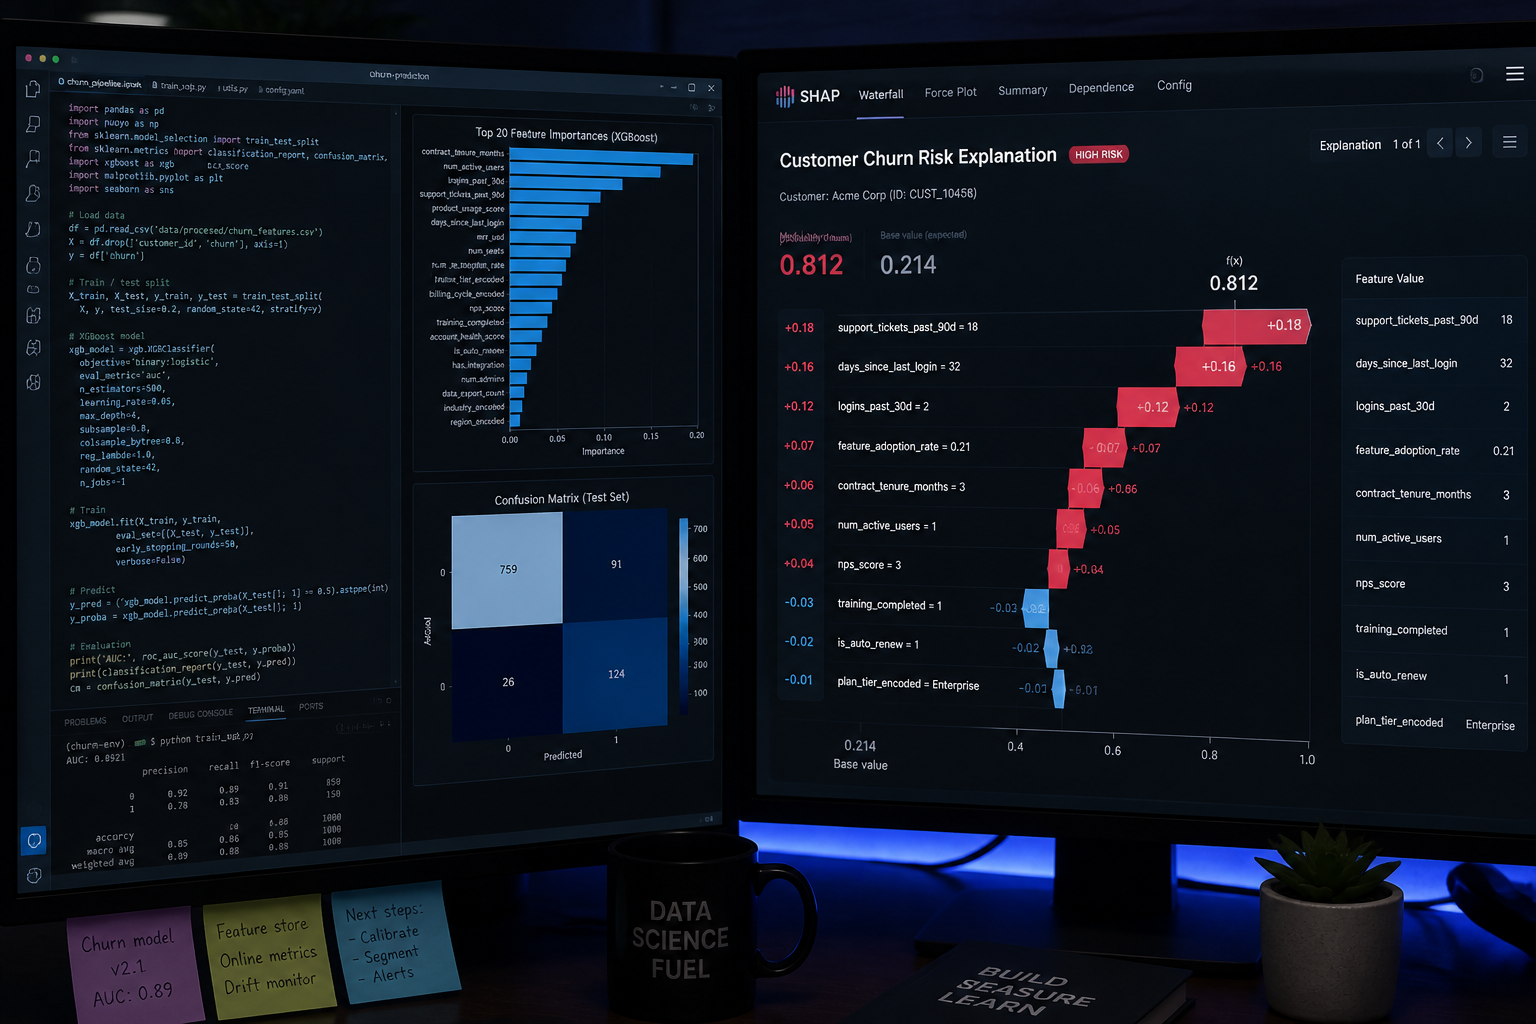
For most business contexts, gradient boosting methods (XGBoost, LightGBM) outperform logistic regression significantly on tabular customer data, particularly when feature sets are mixed-type and interaction effects matter. That said, the model choice depends on the data volume and interpretability requirements.
For high-stakes B2B contexts — where a single churned account could represent hundreds of thousands in ARR — interpretability matters as much as accuracy. Explainable AI techniques (SHAP values) allow customer success managers to understand why a specific account is flagged, not just that it is. This dramatically improves the quality of human intervention.
For high-volume B2C contexts — such as a telecoms provider with millions of subscribers — deep learning architectures can capture sequential behavioural patterns that tabular models miss. Recurrent networks and transformer-based sequence models have shown strong results on usage log data in telecoms and streaming contexts.
Step 4 — Operationalise the Output
Model deployment is where most projects stall. The churn score needs to flow into the tools that customer-facing teams already use. That typically means:
- Scheduled batch scoring jobs pushing propensity scores into CRM (Salesforce, HubSpot, or equivalent)
- Real-time scoring via API for event-triggered interventions (e.g., a user cancels a subscription flow mid-process)
- Automated cohort segmentation feeding personalised retention campaigns in marketing automation tools
If you are looking to implement this kind of end-to-end churn prediction capability in your organisation, explore how Fintel Analytics approaches this — we design and deploy production ML systems for businesses globally, from feature engineering through to CRM integration and continuous model monitoring.
What Results Can Businesses Realistically Expect From Churn Analytics?
Outcome benchmarks vary significantly by industry, model maturity, and intervention quality — but here is what the evidence and practitioner experience suggests:
- Telecoms: Industry studies suggest that well-implemented churn prediction models can reduce monthly churn rates by 15 to 25 percent when paired with targeted retention offers. Given that the average cost to acquire a new mobile subscriber typically exceeds £200 in the UK market, the ROI on retention is substantial.
- B2B SaaS: A common pattern we see with subscription software clients is that flagging accounts with declining product adoption 60 to 90 days before renewal — and routing them to customer success for proactive outreach — consistently reduces net revenue churn by measurable double-digit percentages compared to reactive renewal processes.
- Financial services: Retail banks using machine learning propensity models to identify customers likely to close current accounts or transfer ISA balances have reported retention improvements in targeted segments. The challenge here is balancing retention incentives against margin impact, which is where prescriptive analytics becomes essential — recommending not just who to target but what offer to make to each customer.
- Retail subscription: D2C subscription businesses (beauty, food, apparel) using multi-signal churn models have reported reductions in monthly cancellation rates of 10 to 20 percent when combining predictive scoring with personalised pause and skip options offered at the right moment in the cancellation journey.
The consistent finding across sectors is that the quality of the intervention matters as much as the quality of the prediction. A high-precision churn model paired with a generic discount is far less effective than a moderate model paired with a personalised, well-timed, high-value intervention.
How Do You Measure Whether Your Churn Analytics Programme Is Working?
This is the question that separates organisations running genuine retention analytics programmes from those running retention theatre. The right measurement framework has three layers:
Layer 1 — Model performance metrics Precision, recall, AUC-ROC, and F1 score measure how well the model identifies actual churners. For most business contexts, recall (catching as many true churners as possible) matters more than precision — the cost of a false positive (contacting a customer who was not going to churn) is usually far lower than a false negative (missing a customer who was). Most production churn models target AUC scores of 0.75 to 0.90 depending on data richness.
Layer 2 — Intervention lift metrics This is where true programme value is measured. Use controlled holdout experiments to compare the retention rate of customers who received an intervention against a matched control group who did not. Without this, you cannot attribute retention improvement to the model rather than natural customer behaviour. A/B testing discipline is non-negotiable here — for a full treatment of how to run this rigorously, see our guide on A/B Testing Analytics: How to Make Smarter Experiments in 2026.
Layer 3 — Commercial impact metrics Ultimately, the programme is measured in revenue retained. Track: incremental ARR saved, reduction in net revenue churn, change in average customer lifetime, and return on retention spend. These should feed directly into board-level reporting.
What Are the Common Pitfalls to Avoid When Scaling Churn Analytics?
Scaling from a proof-of-concept churn model to a production programme that runs continuously and improves over time requires avoiding several well-documented failure modes:
- Data leakage in model training: Including features that are only observable after churn has occurred (e.g., the final support ticket before cancellation) inflates training performance but destroys production accuracy. Rigorous temporal feature engineering — ensuring all features are computed from data available at prediction time — is essential.
- Model staleness: Customer behaviour evolves. A model trained on pre-2024 data may underperform significantly on today's customers if market conditions, product changes, or competitive dynamics have shifted. Continuous monitoring and scheduled retraining pipelines are not optional — they are part of the system.
- Intervention fatigue: Over-contacting at-risk customers can accelerate churn rather than prevent it. Scoring should incorporate contact history and channel preferences to avoid the model inadvertently making things worse.
- Ignoring recoverable churn: Some customers who lapse can be reactivated. Distinguishing between likely-permanent and potentially-recoverable churn allows businesses to run separate win-back programmes alongside active retention — doubling the commercial return from the same modelling infrastructure.
Frequently Asked Questions
Q: What is churn analytics and how does it work?
A: Churn analytics uses historical customer data, behavioural signals, and machine learning to predict which customers are likely to leave before they do. It works by engineering features from multiple data sources, training a predictive model on labelled churn examples, and scoring current customers to generate a propensity-to-churn ranking that enables targeted retention interventions.
Q: What data do you need to build a churn prediction model?
A: The most effective churn models draw on transactional data (purchase frequency, spend trends), behavioural data (product usage, login activity, feature engagement), sentiment data (support ticket content, NPS scores), and contextual data (contract tenure, pricing tier, competitive signals). The more signal types you include, the more accurate and actionable the model becomes.
Q: How accurate can a churn prediction model realistically be?
A: Production churn models typically achieve AUC-ROC scores between 0.75 and 0.90, depending on data richness and the predictability of churn in your specific context. Model accuracy is necessary but not sufficient — the intervention quality and operational integration determine the commercial outcome, not the model score alone.
Q: How long does it take to build a churn analytics capability?
A: A minimum viable churn prediction model can be built and deployed in four to eight weeks with clean, accessible data. A full production capability — including real-time scoring, CRM integration, automated interventions, and monitoring — typically takes three to six months. Timeline is heavily dependent on data infrastructure maturity.
Q: What industries benefit most from churn analytics?
A: Churn analytics delivers the strongest ROI in industries with recurring revenue models: subscription software (SaaS), telecoms, financial services, streaming media, D2C subscription retail, and utilities. Any business where customer lifetime value is significantly higher than acquisition cost — and where churn has a compounding effect on revenue — should treat churn prediction as a priority analytics investment.
Building a churn analytics programme that actually reduces customer loss — rather than just measuring it — requires clean data architecture, well-engineered features, models calibrated to your specific business dynamics, and tight integration with the commercial workflows where retention decisions are made. At Fintel Analytics, we have helped SaaS businesses, financial services firms, and subscription retailers build exactly this kind of capability, from initial data audit and feature design through to production ML deployment and continuous monitoring. If your organisation is watching customers leave without a clear picture of who was at risk or why, that is a solvable problem — and solving it tends to pay back the investment many times over.